moves_plot <- moves |> rowid_to_column("time")
final_floor <- tail(moves$height, 1)
moves_plot |>
ggplot(aes(x = time, y = height)) +
geom_line() +
geom_hline(yintercept = 0, linetype = "dashed", color = "gray50", alpha = 0.5) +
geom_point(data = moves_plot |> filter(time == basement_entry_position),
color = "red", size = 3) +
geom_point(data = moves_plot |> filter(time == max(time)),
color = "blue", size = 3) +
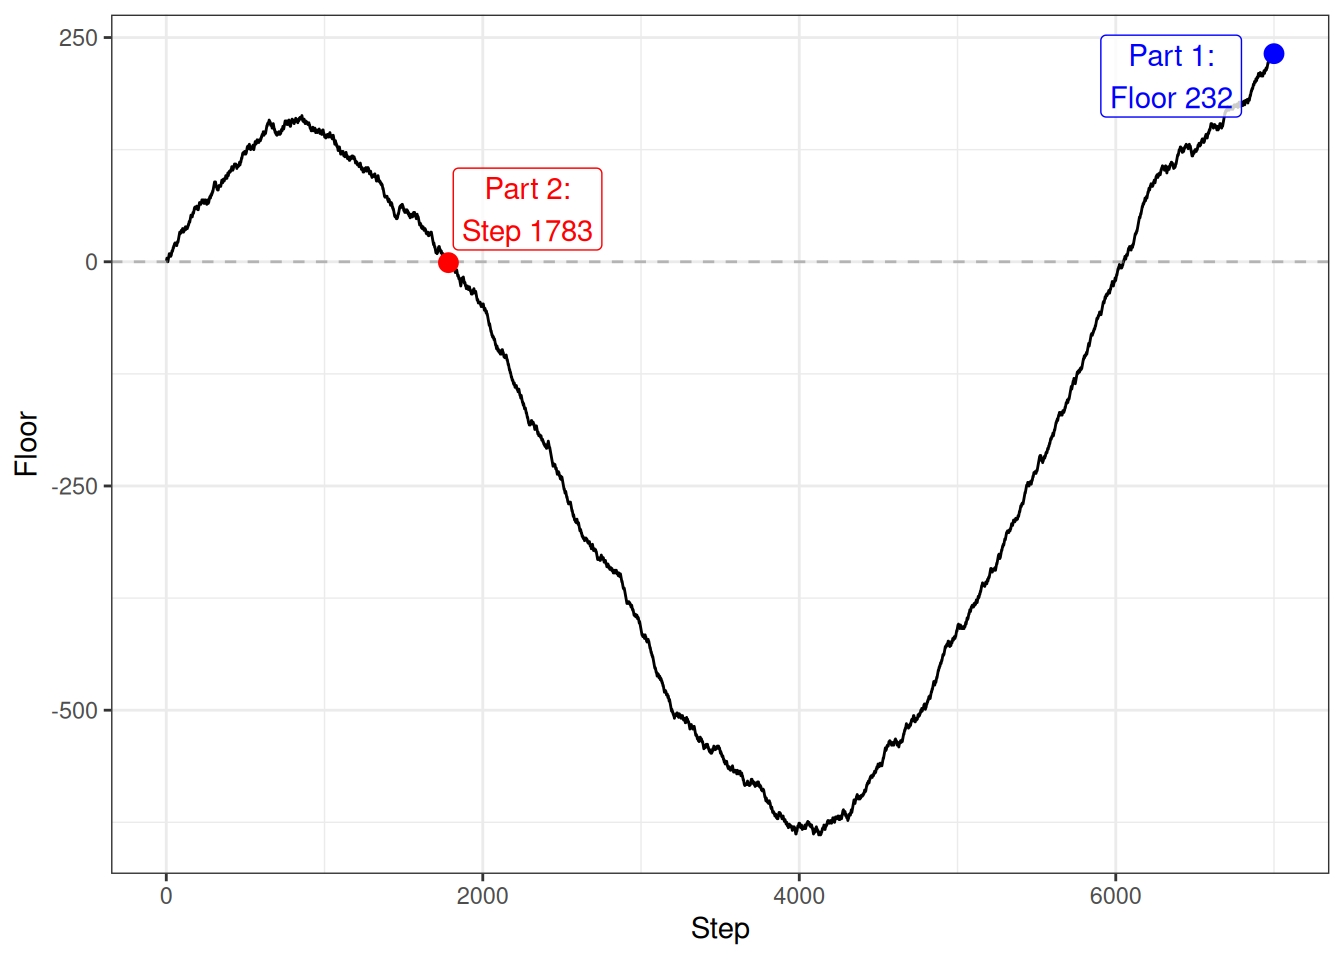
annotate("label", x = max(moves_plot$time) - 650, y = final_floor - 25,
label = paste("Part 1:\nFloor", final_floor),
color = "blue", fill = "white", alpha = 0.8) +
annotate("label", x = basement_entry_position + 500, y = 150,
label = paste("Part 2:\nStep", basement_entry_position),
vjust = 1.5, color = "red", fill = "white", alpha = 0.8) +
labs(x = "Step", y = "Floor") +
theme_bw()