Classification Part 1
Fundamentals of Machine Learning for NHS using R
Classification
- Part 1 Logistic Regression
- Part 2 Decision Trees & Random Forests
Logistic Regression
Logistic Regression
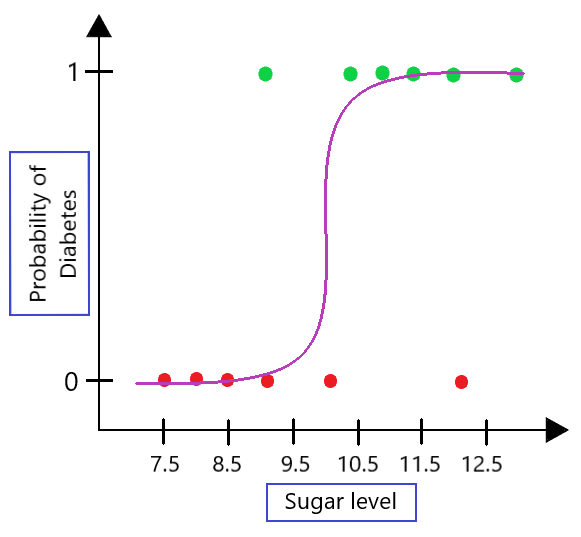
- Logistic regression is foremost used to model a binary (0,1) variable \(Y\), based on one or more other variables, called predictors.
- The binary variable being modelled is generally referred to as the response variable, or the dependent variable.
Logistic Regression
- For a model to fit the data well, it is assumed that:
- The predictors are uncorrelated with one another.
- That they are significantly related to the response variable.
- The observations or data elements of a model are also uncorrelated.
Logistic Regression
- Logistic regression is typically utilised for 3 purposes:
- To predict the probability that the response variable \(Y\) is equal to 1.
- To categorise outcomes or predictors.
- To assess the odds or risk associated with model predictors.
Logistic Regression
Aim: To predict the dependent variable \(Y\). \[P(Y=0)=1-P(Y=1)\] Denote \(k\) independent variables \[x_1,x_2, .,x_k\]
Logistic Regression
- At the centre of logistic regression analysis is the task of estimating the log odds of an event. \[ Odds = P(Y=1)/P(Y=0) \]
- Odds \(> 1 if (Y=1)\) is more likely
- Odds \(< 1 if (Y=0)\) is more likely
Logistic Regression
Suppose we roll a dice numbered 1 to 6 and we are interested in the outcome of rolling greater than a 2. \[ P(Roll>2) = 4/6 \\ P(Roll \leq 2) = 2/6 \] Therefore, the odds of rolling >2 \[ Odds=P(Roll>2)/P(Roll \leq 2)= 4/2 = 2 \] Odds 2:1
Logistic regression
However, there is a problem using this calculation in the model. If probability =1 then \[
Odds = 1/0= \infty
\]
So, we use log odds instead. \[
Odds = Ln(P(Y=1)/P(Y=0) )
\] It maps probability ranging between 0 and 1 to log odds ranging from negative infinity to positive infinity.
Logistic regression
Logistic Regression
From mathematics, it can be shown that: \[ Ln\frac{P(Y=1)}{P(Y=0)}=\beta_0+\beta_1x_1+\beta_2x_2+\ldots+\beta_k x_k \] Hence we need to rearrange this function in terms of P(Y=1).
Logistic Regression
Given the fact that \[ \frac{P(Y=1)}{P(Y=0)}=\frac{P(Y=1)}{1 - P(Y=1)} \]
Logistic Regression
Taking logs of both sides you get \[ \frac{P(Y=1)}{1 - P(Y=1)} = e^{\beta_0+\beta_1x_1+\beta_2x_2+\ldots+\beta_k x_k} \]
Logistic Regression
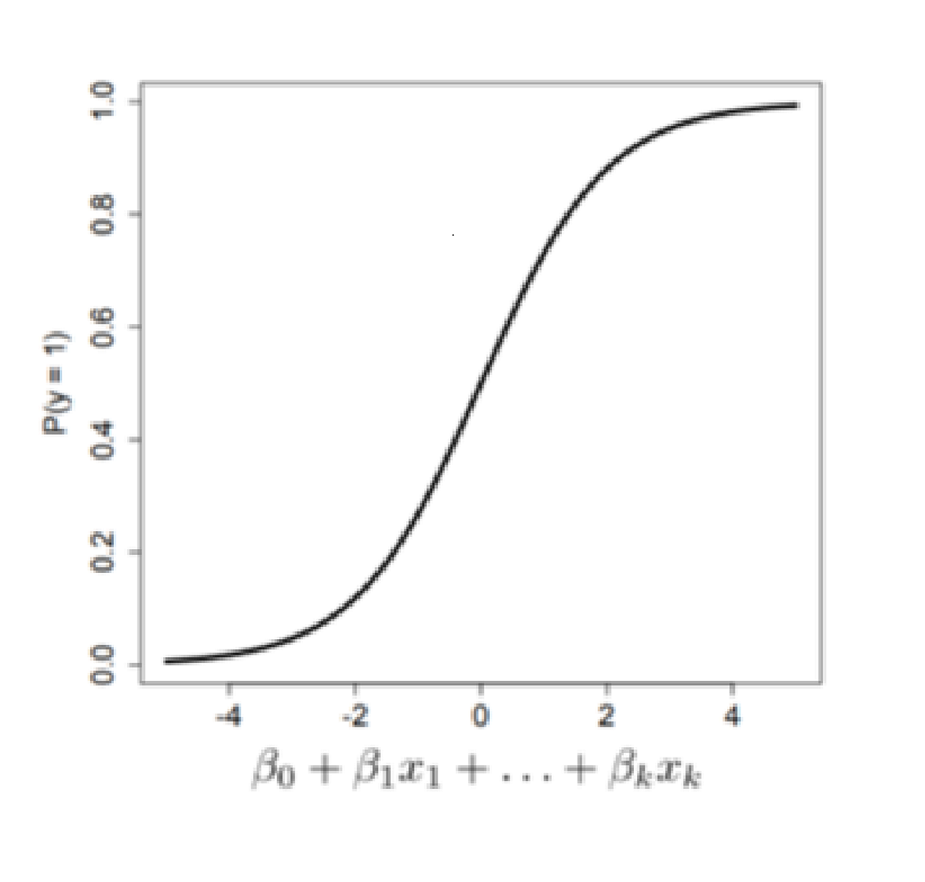
The logit function or the log-odds is therefore \[ P(Y=1) = \frac{1}{1 + e^-(\beta_0+\beta_1x_1+\beta_2x_2+\ldots+\beta_k x_k)} \]
Logistic Regression
- Positive values are predicted as class 1
- Negative values are predicted as class 0
- The coefficients are selected to:
- Predict a high probability for the positive cases
- Predict a low probability for the low cases
Logisitc Regression
Logistic Regression
- After fitting the model, it is likely that researchers will want to examine the contribution of individual predictors.
- To do so, they will want to examine the regression coefficients.
- In logistic regression, there are several different tests designed to assess the significance of an individual predictor.
Logistic Regression
- The AIC provides a method for assessing the quality of your model through comparison of related models.
- Unlike adjusted R-squared, the number itself is not meaningful.
- If you have more than one similar candidate models, then you should select the model that has the smallest AIC.
- So its useful for comparing models, but isn’t interpretable on its own.
Workshop: Logistic Regression
Thank you!
Questions?