Data Preparation
Fundamentals of Machine Learning for NHS using R
Today’s Plan
- Data Preparation
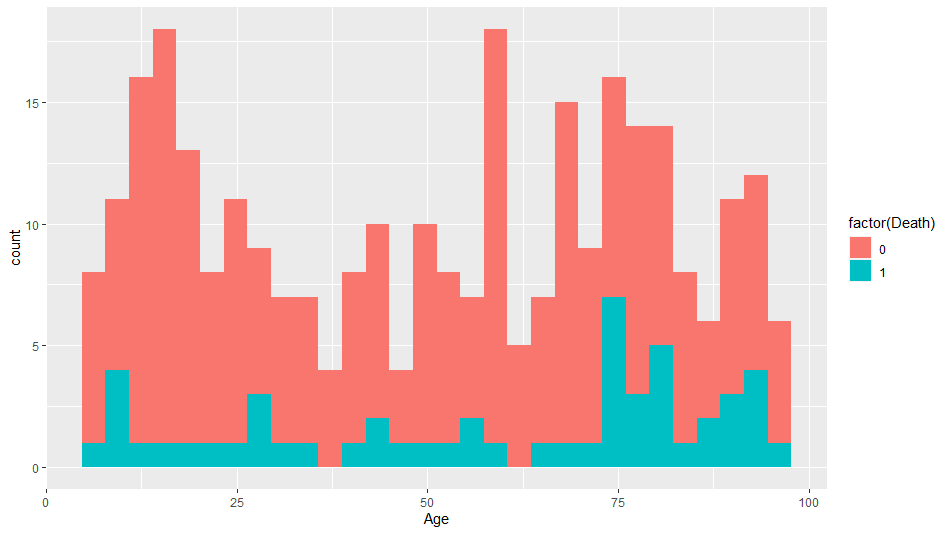
- Exploratory data analysis
- Handling missing data.
Data Preparation
Why is EDA important?
Exploratory data analysis (EDA) is used by data scientists to analyse and investigate data sets and summarise their main characteristics.
It makes it easier for data scientists to discover patterns, spot anomalies, test a hypothesis, or check assumptions.
Once EDA is complete and insights are drawn, its features can then be used for more sophisticated data analysis or modelling, including machine learning.
How to perform EDA
- Look at the raw data values.
- Compute summary statistics like mean, the median, the standard deviation, interquartile range.
- Create data visualisations by plotting different types of graphs to answer insightful questions on the data.
Generate initial hypotheses
Why is pre-processing important?
- Data in the real world is quite dirty and corrupted with inconsistencies, noise, incomplete information, and missing values.
- Duplicate or missing values may give an incorrect view of the overall statistics of data.
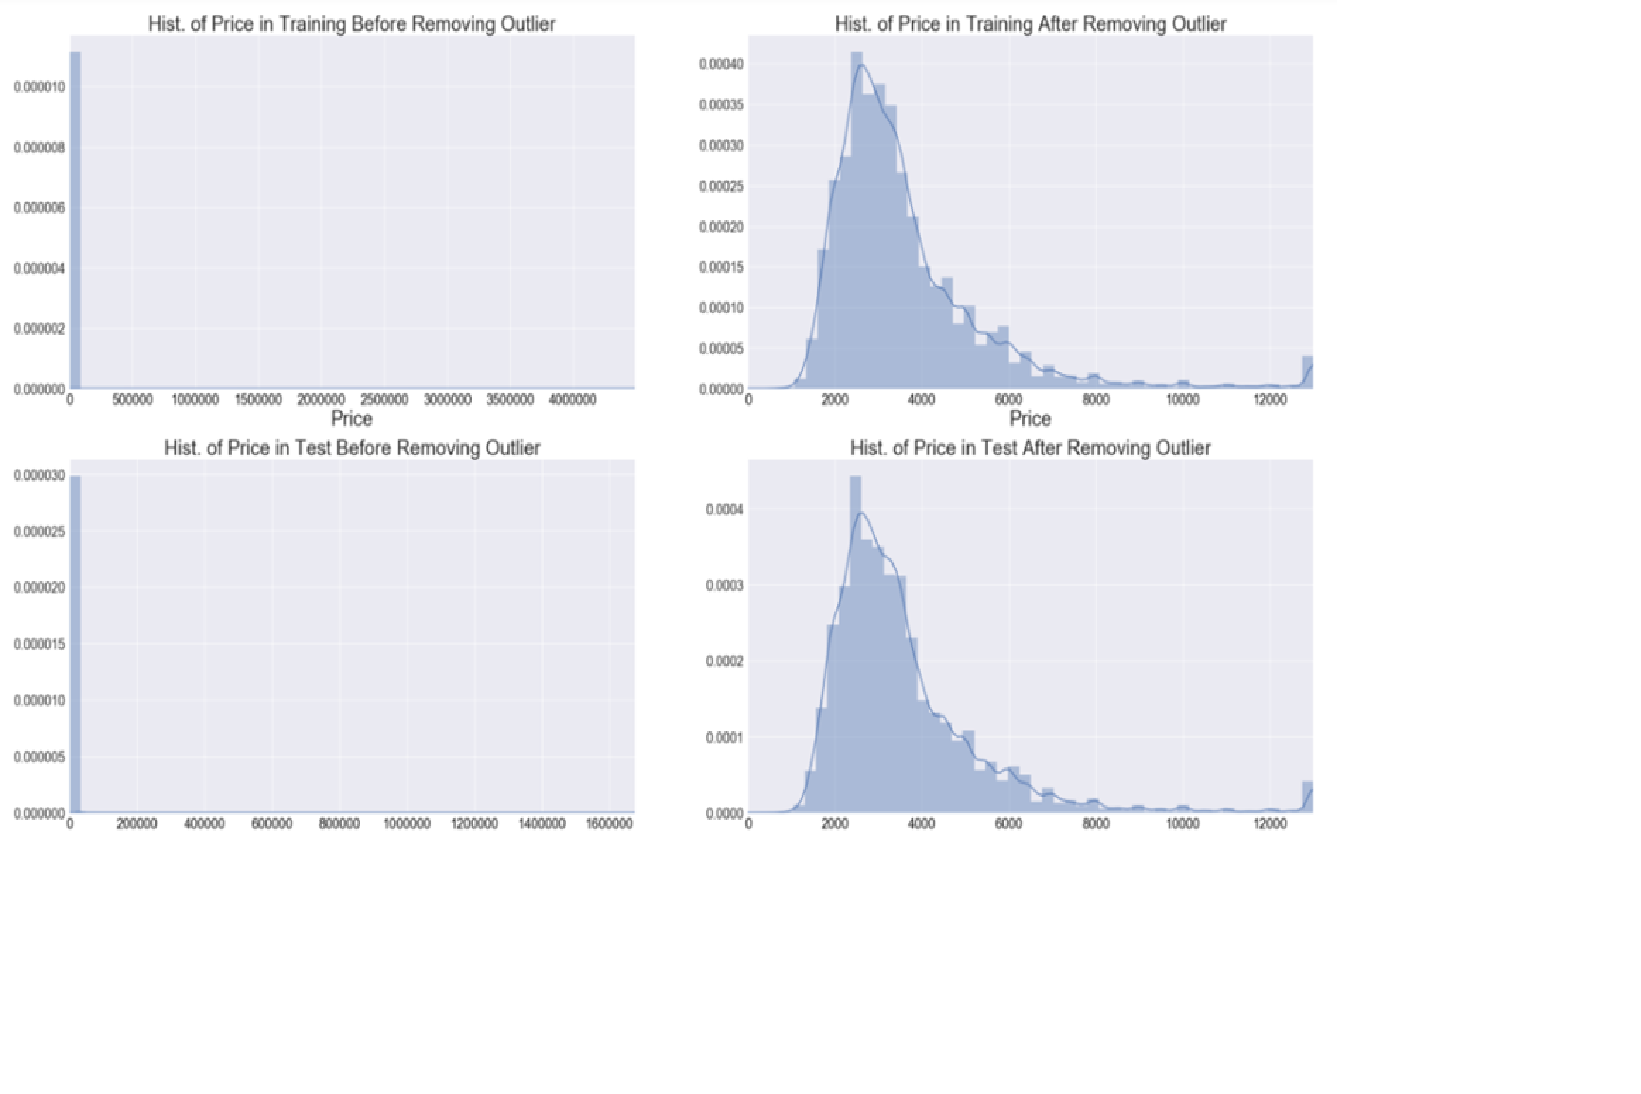
- Outliers and inconsistent data points often tend to disturb a model’s overall learning, leading to false predictions.
Data Errors
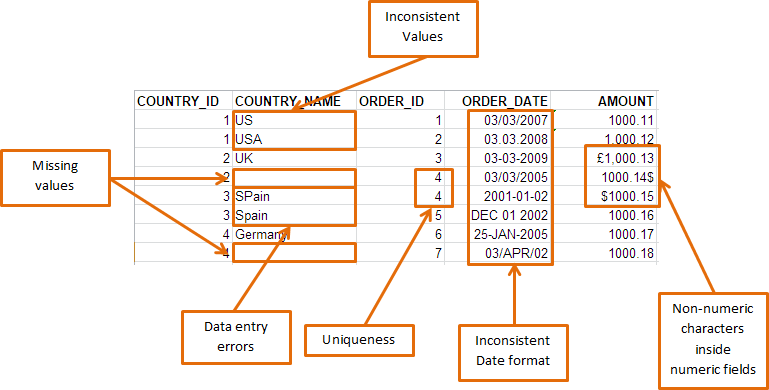
Data Errors
Errors can occur during measurement and data entry.
If you determine that an outlier value is an error, correct the value when possible.
If that’s not possible, you must delete the data point because you know it’s an incorrect value.
Outliers
It’s essential to understand how outliers occur and whether they might happen again as a normal part of the process or study area.
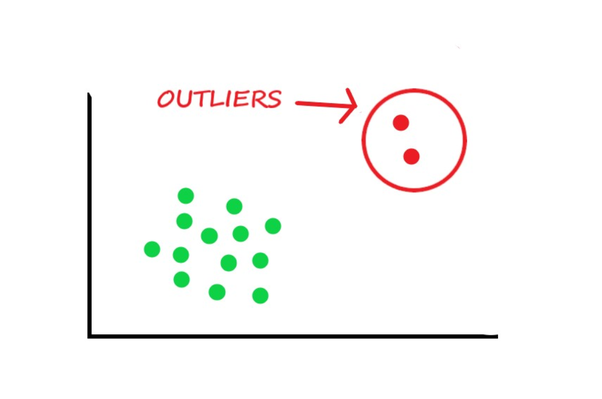
Outliers
- Sometimes it’s best to keep outliers in the data. They can capture valuable information.
- Excluding extreme values solely due to their extremeness can distort the results by removing information about the variability inherent in the data. You’re forcing the data to appear less variable than it is in reality.
- You’ll need to evaluate if it appropriately reflects your target population, subject-area, research question, and research methodology.
Outliers
Outliers
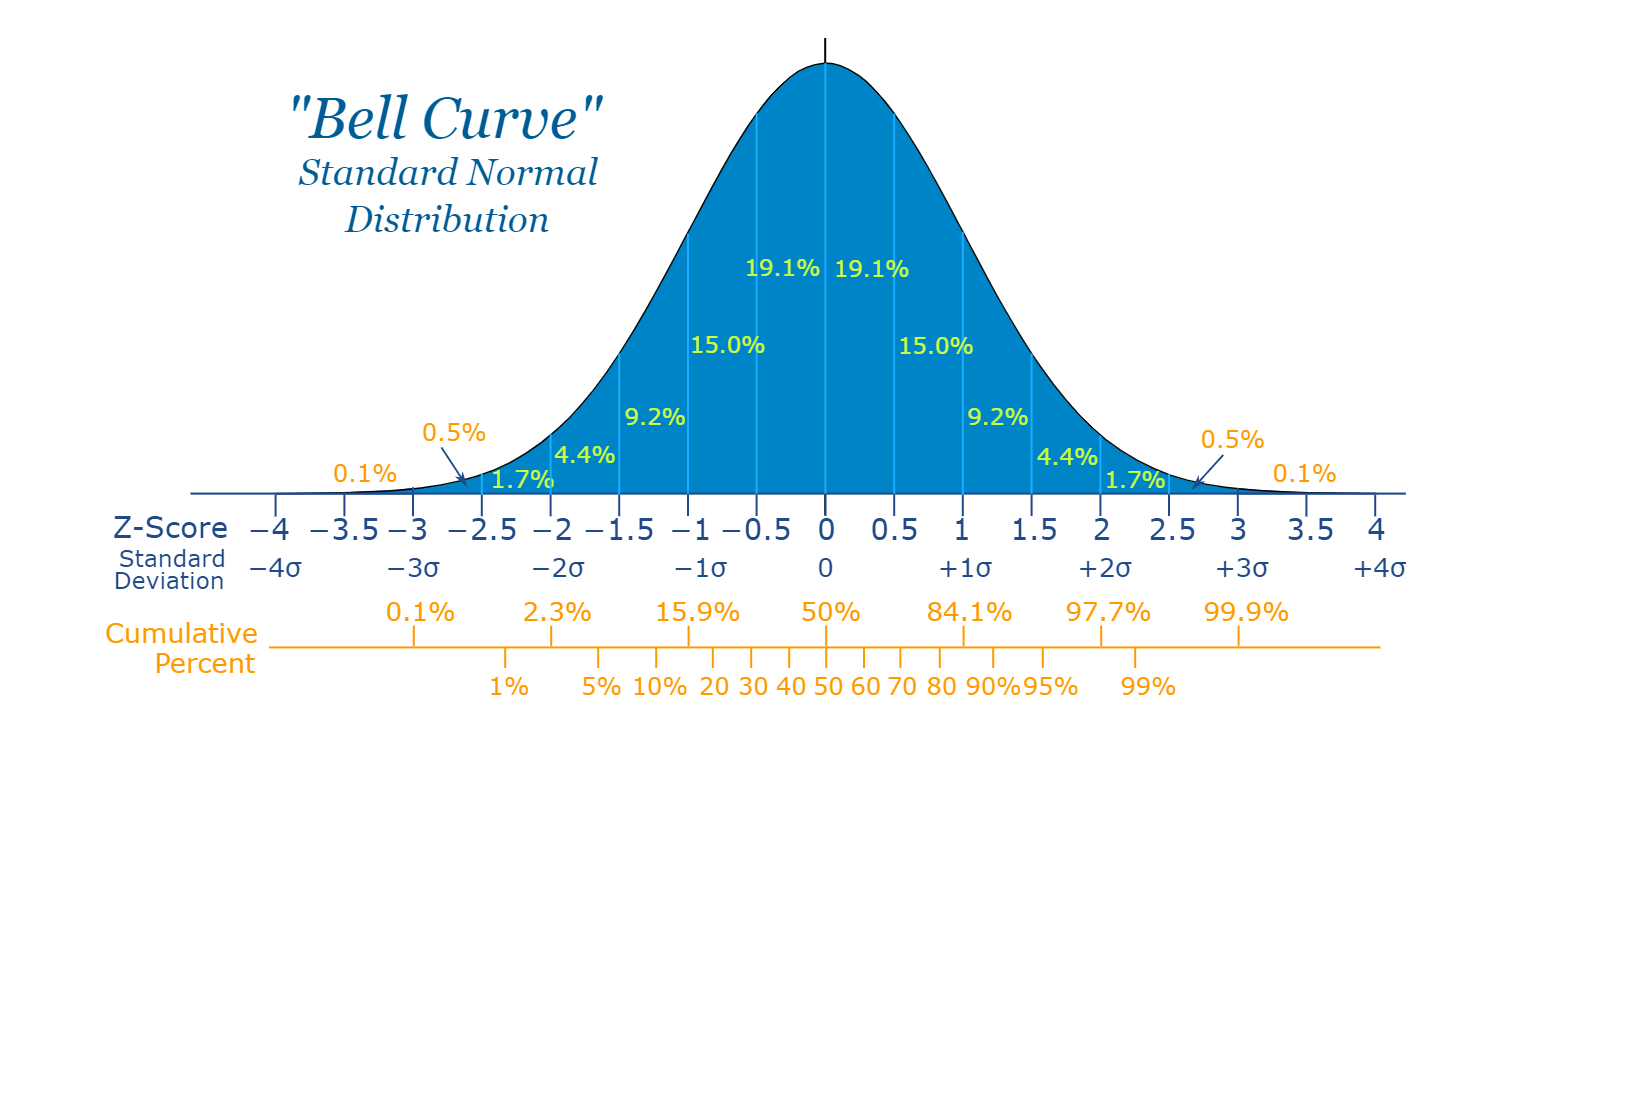
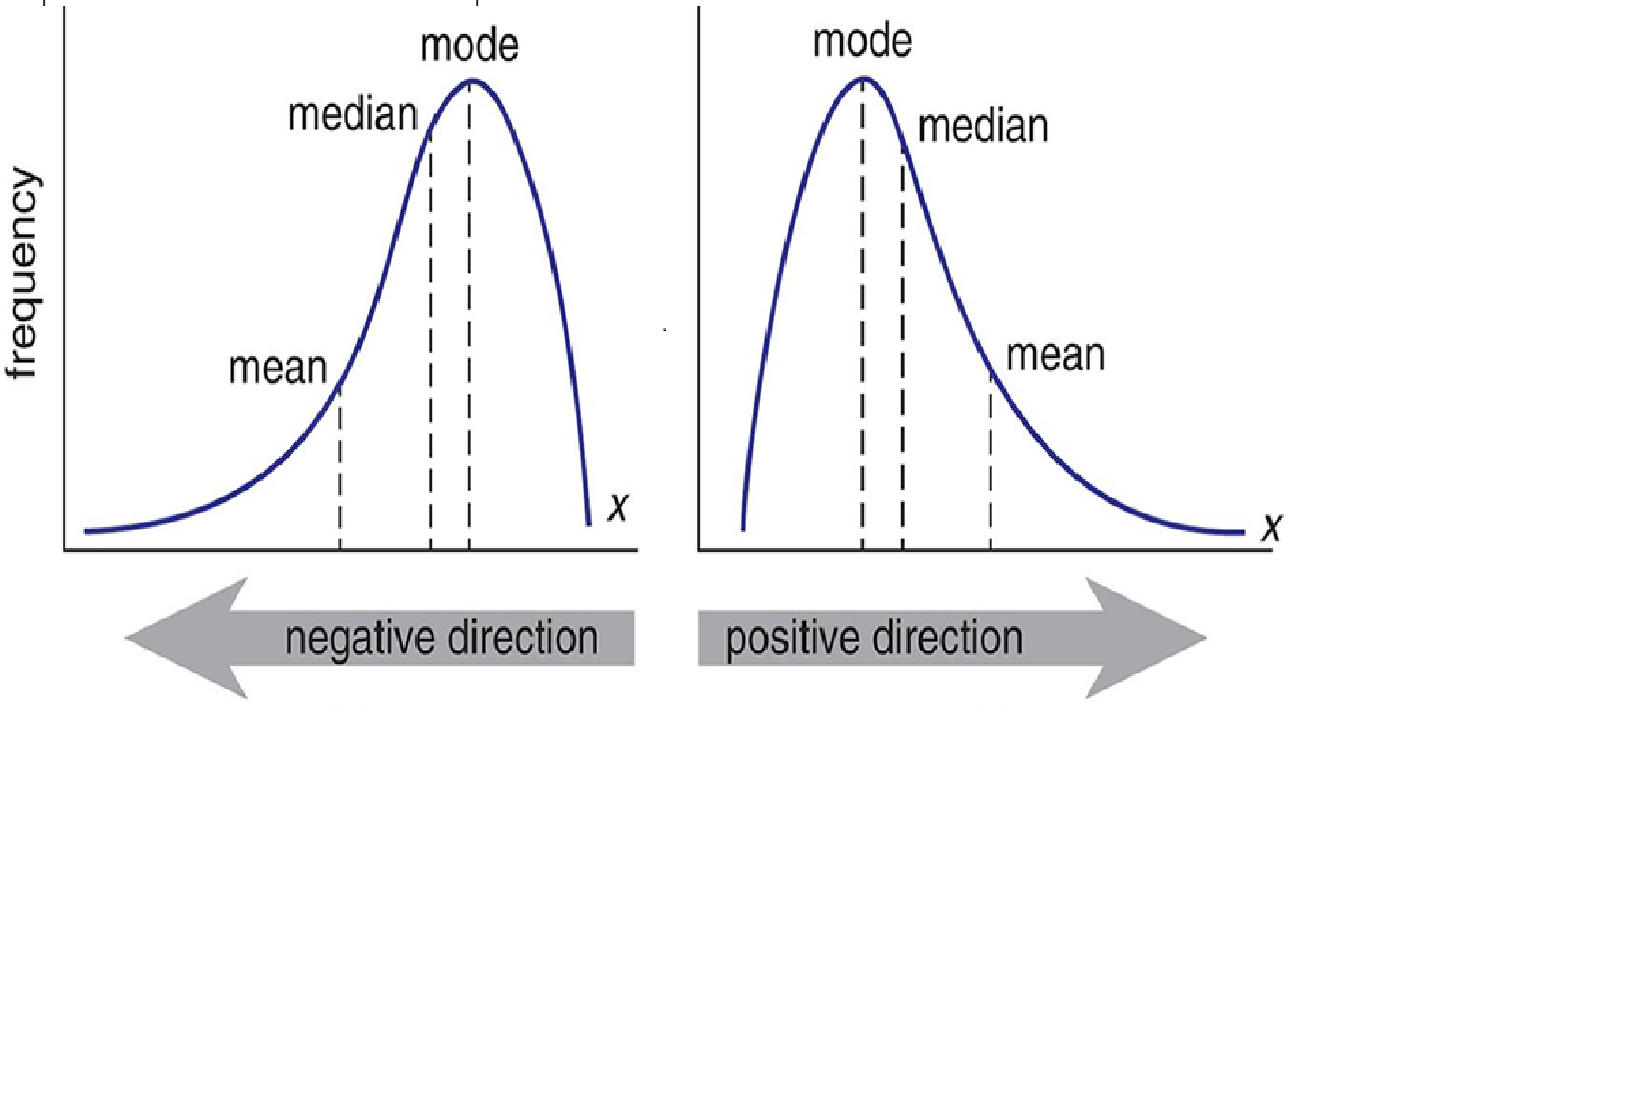
- All data distributions have a spread of values. Extreme values can occur, but they have lower probabilities.
- In a normal distribution, approximately 1 in 340 observations will be at least three standard deviations away from the mean.
Normal distribution
Boxplot
Data points that lie 1.5 times of IQR above Q3 and below Q1 are outliers. 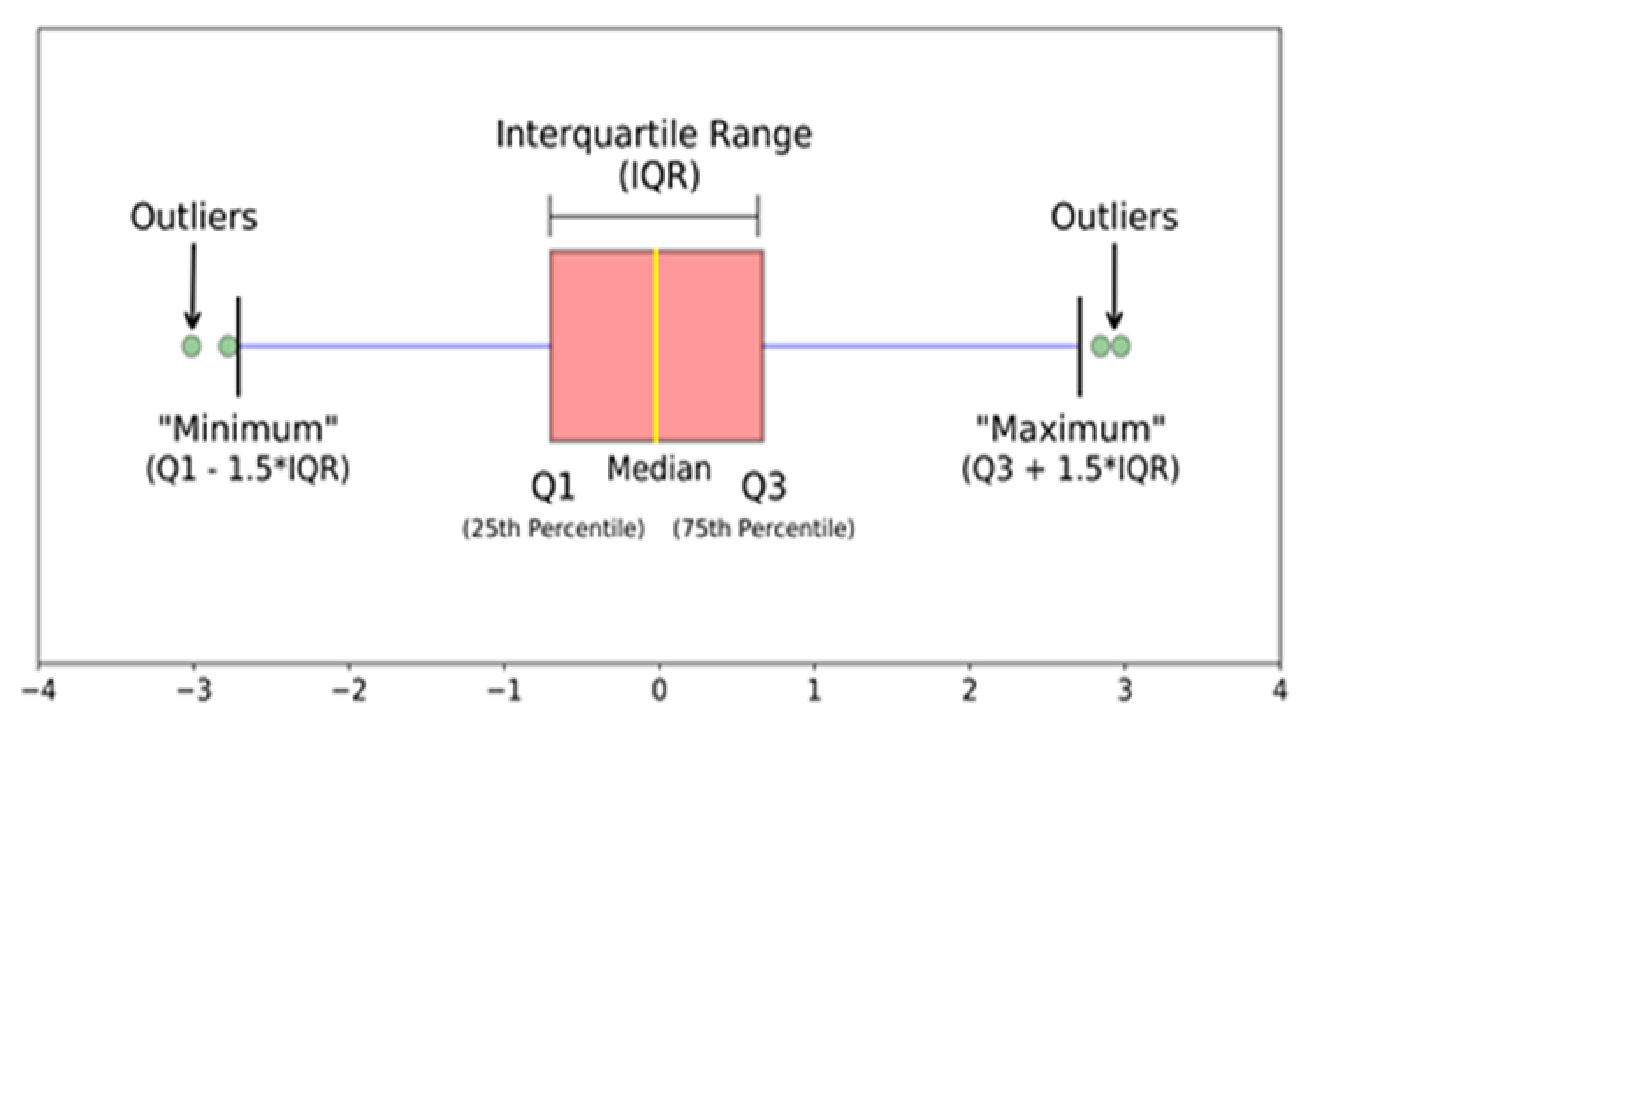
Missing values
- It is important to understand why the values are missing!
- Could be structurally missing for example, income of someone unemployed.
- May be concentrated in a subset of predictors rather than occurring randomly across all predictors.
Types of missing values
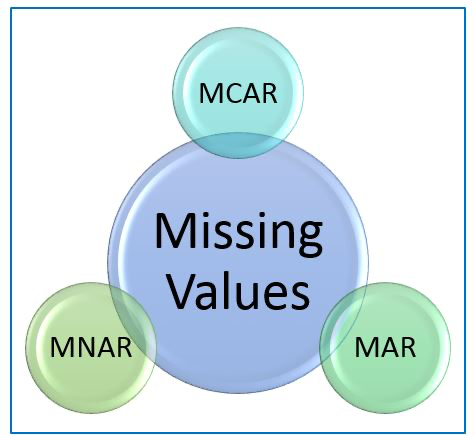
Types of missing values
Formally the missing values are categorised as follows:
- Missing Completely At Random (MCAR)
- Missing At Random (MAR)
- Missing Not At Random (MNAR)
Missing Completely At Random (MCAR)
The probability of data being missing is the same for all the observations. That is, missing values are completely independent of other data.
The data could be missing due to human error, some system/equipment failure, loss of sample, or some unsatisfactory technicalities while recording the values.
It should not be assumed as it’s a rare case. The advantage of such data is that the statistical analysis remains unbiased.
Missing At Random (MAR)
- Missing at random (MAR) means that the reason for missing values can be explained by variables on which you have complete information as there is some relationship between the missing data and other values/data.
- In this case, the data is not missing for all the observations. It is missing only within sub-samples of the data and there is some pattern in the missing values.
- In this case, the statistical analysis might result in bias.
Missing NOT At Random (MNAR)
- If there is some structure/pattern in missing data and other observed data can not explain it, then it is Missing Not At Random (MNAR).
- It can happen due to the reluctance of people in providing the required information. A specific group of people may not answer some questions in a survey.
- In the case of MNAR as well the statistical analysis might result in bias.
Handling Missing values
- Delete the missing data
- If the missing value is of the type MNAR, then it should not be deleted.
- This technique is suitable when dealing with big datasets and with very few missing values.
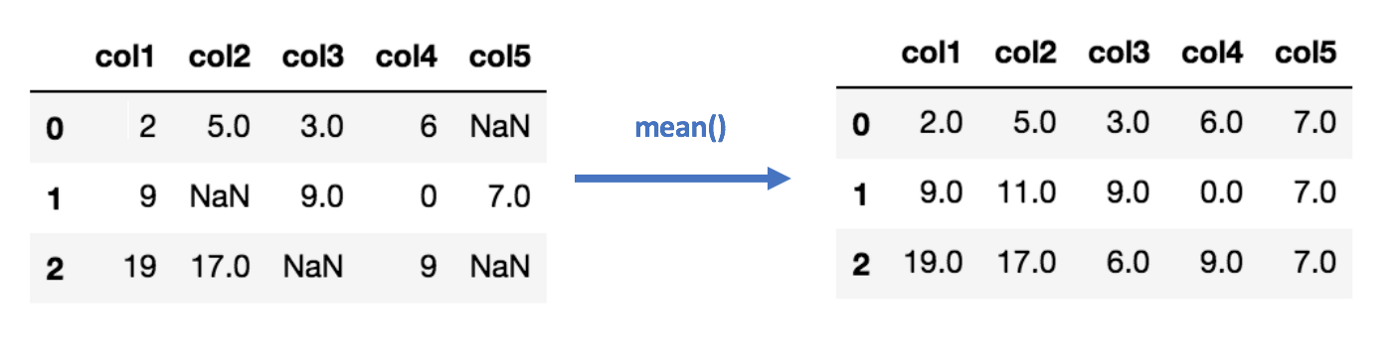
- Replace the missing data with a statistic of the feature in which the data is missing.
- This technique is the best way so far to deal with the missing values and is known as imputation.
Deleting missing values
- If a row has many missing values then you can choose to drop the entire row.
- If every row has some (column) value missing then you might end up deleting the whole data.
- If a certain column has many missing values then you can choose to drop the entire column.
Data Imputation
- Arbitrary value
- Mean
- Median
- Mode
- Forward/Backward fill
- Interpolation
Mean imputation
 What are the disadvantages of using the mean?
Data Imputation
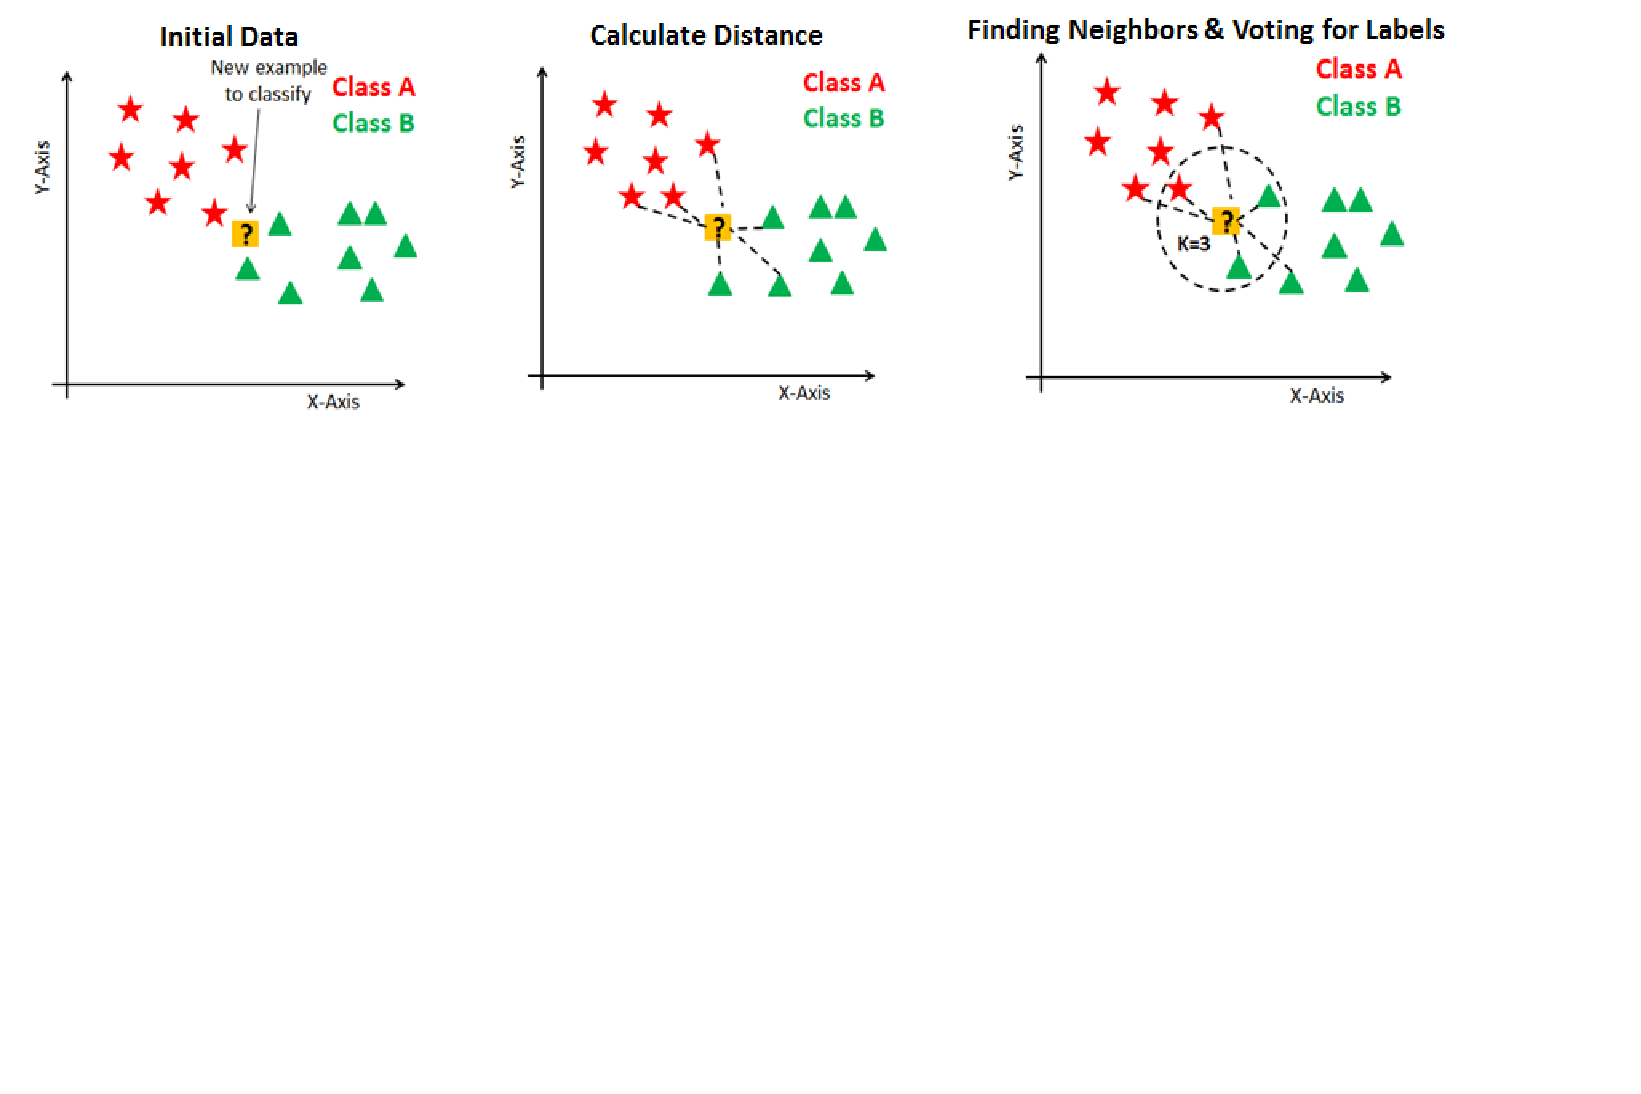
K nearest neighbours
Missing values are imputed using the k-Nearest Neighbors approach where a Euclidean distance is used to find the nearest neighbors.
Clustering Methods
Creation of groups/clusters from data having similar values. The values that don’t lie in the cluster can be treated as outliers and can be removed. 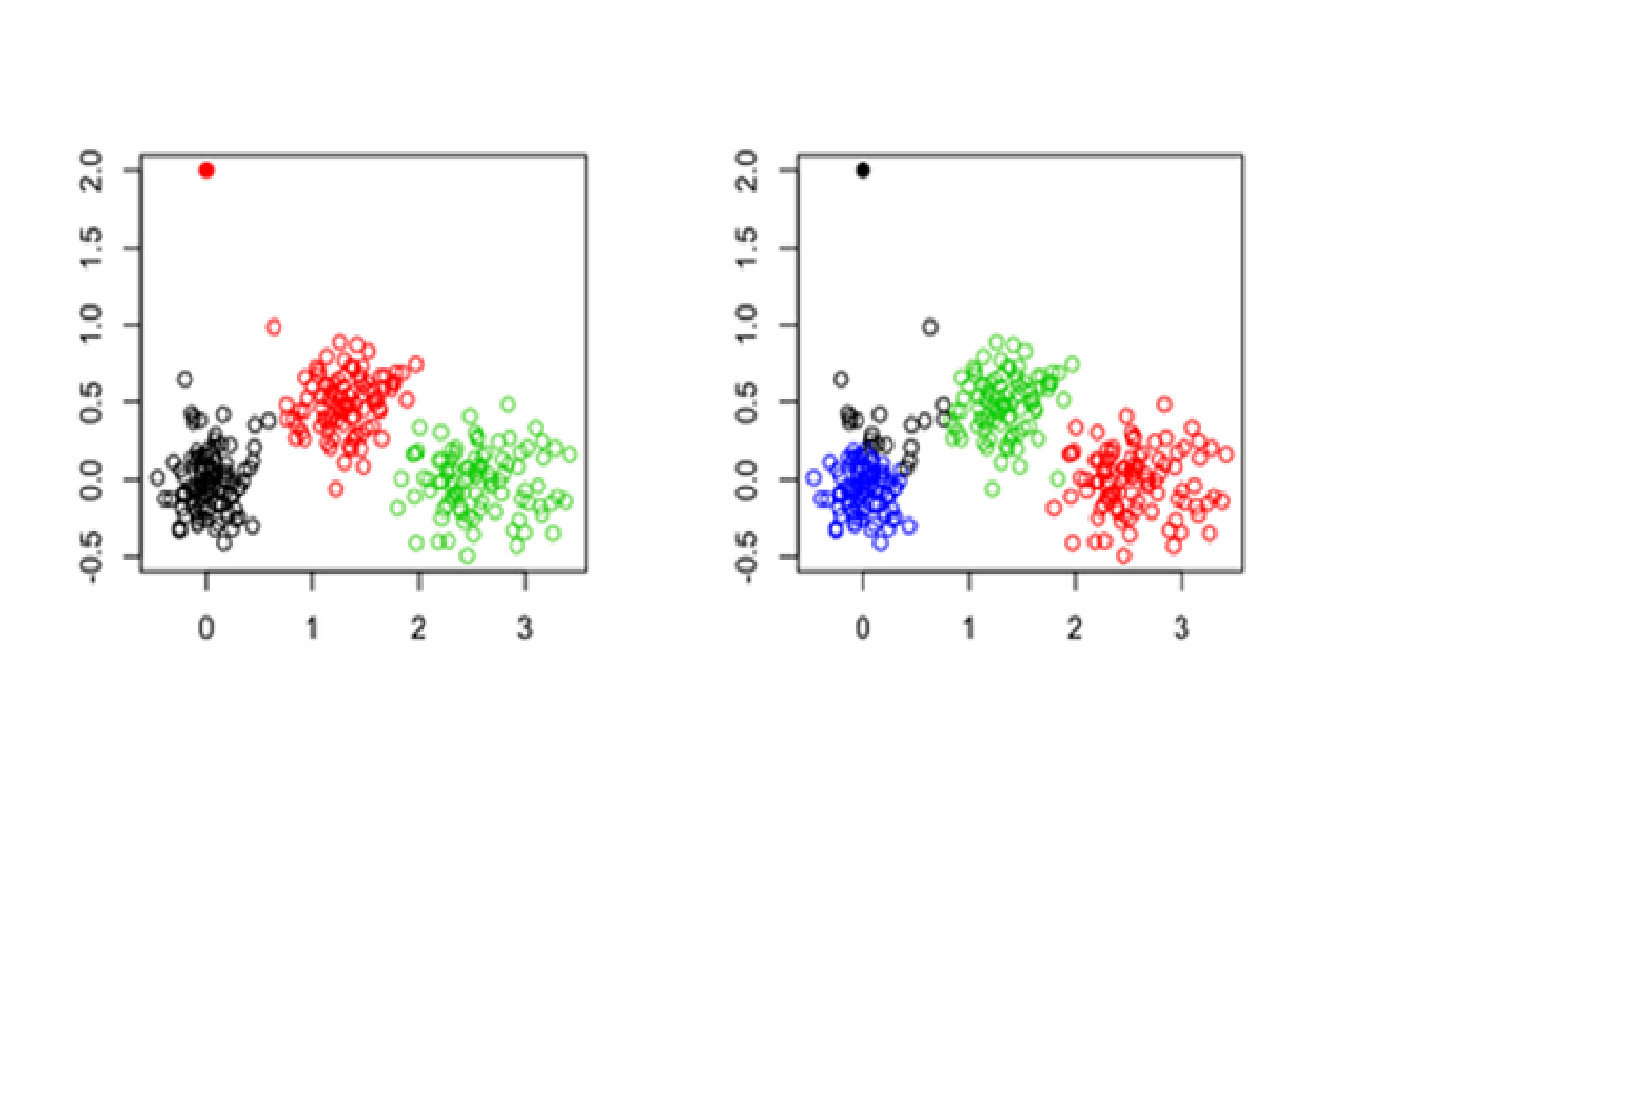
Workshop Part 1: Data Preparation
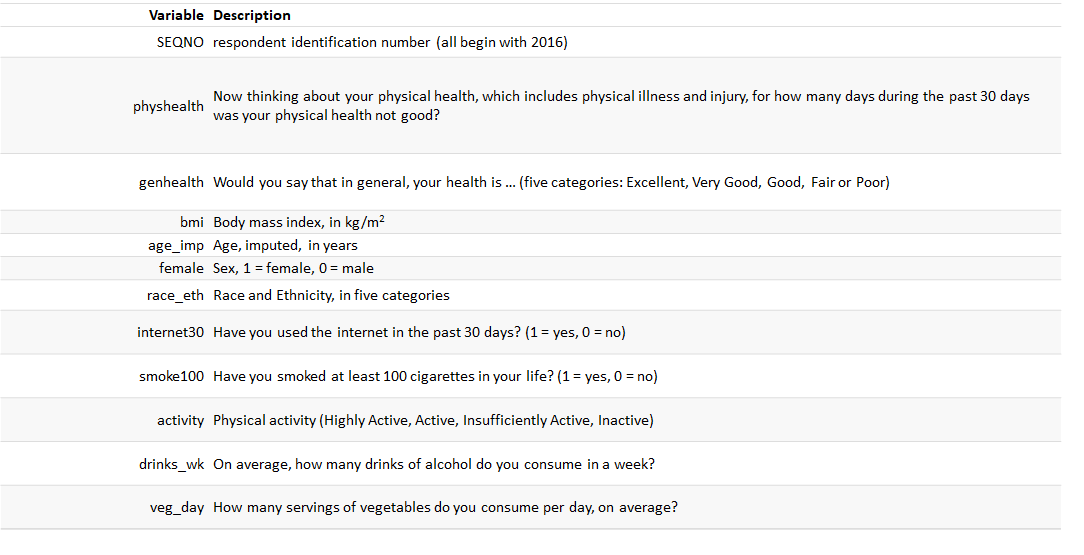
smart_cle data
- The Centers for Disease Control analyses Behavioural Risk Factor Surveillance System (BRFSS) survey data for specific metropolitan and micropolitan statistical areas (MMSAs).
- The purpose of this survey is to provide localised health information that can help public health practitioners identify local emerging health problems, plan and evaluate local responses, and efficiently allocate resources to specific needs.
smart_cle data
We will focus on data from the 2017 SMART, from the state of Ohio, and from the Cleveland-Elyria, OH, Metropolitan Statistical Area.
smart_cle data
Next week…
Feature Engineering
Thank you!
Questions?