# A tibble: 1 × 2
  `Median Bill Length` `Median Bill Depth`
                 <dbl>               <dbl>
1 44.5 17.3Data Visualisation II
Fundamentals of Data Science for NHS using R
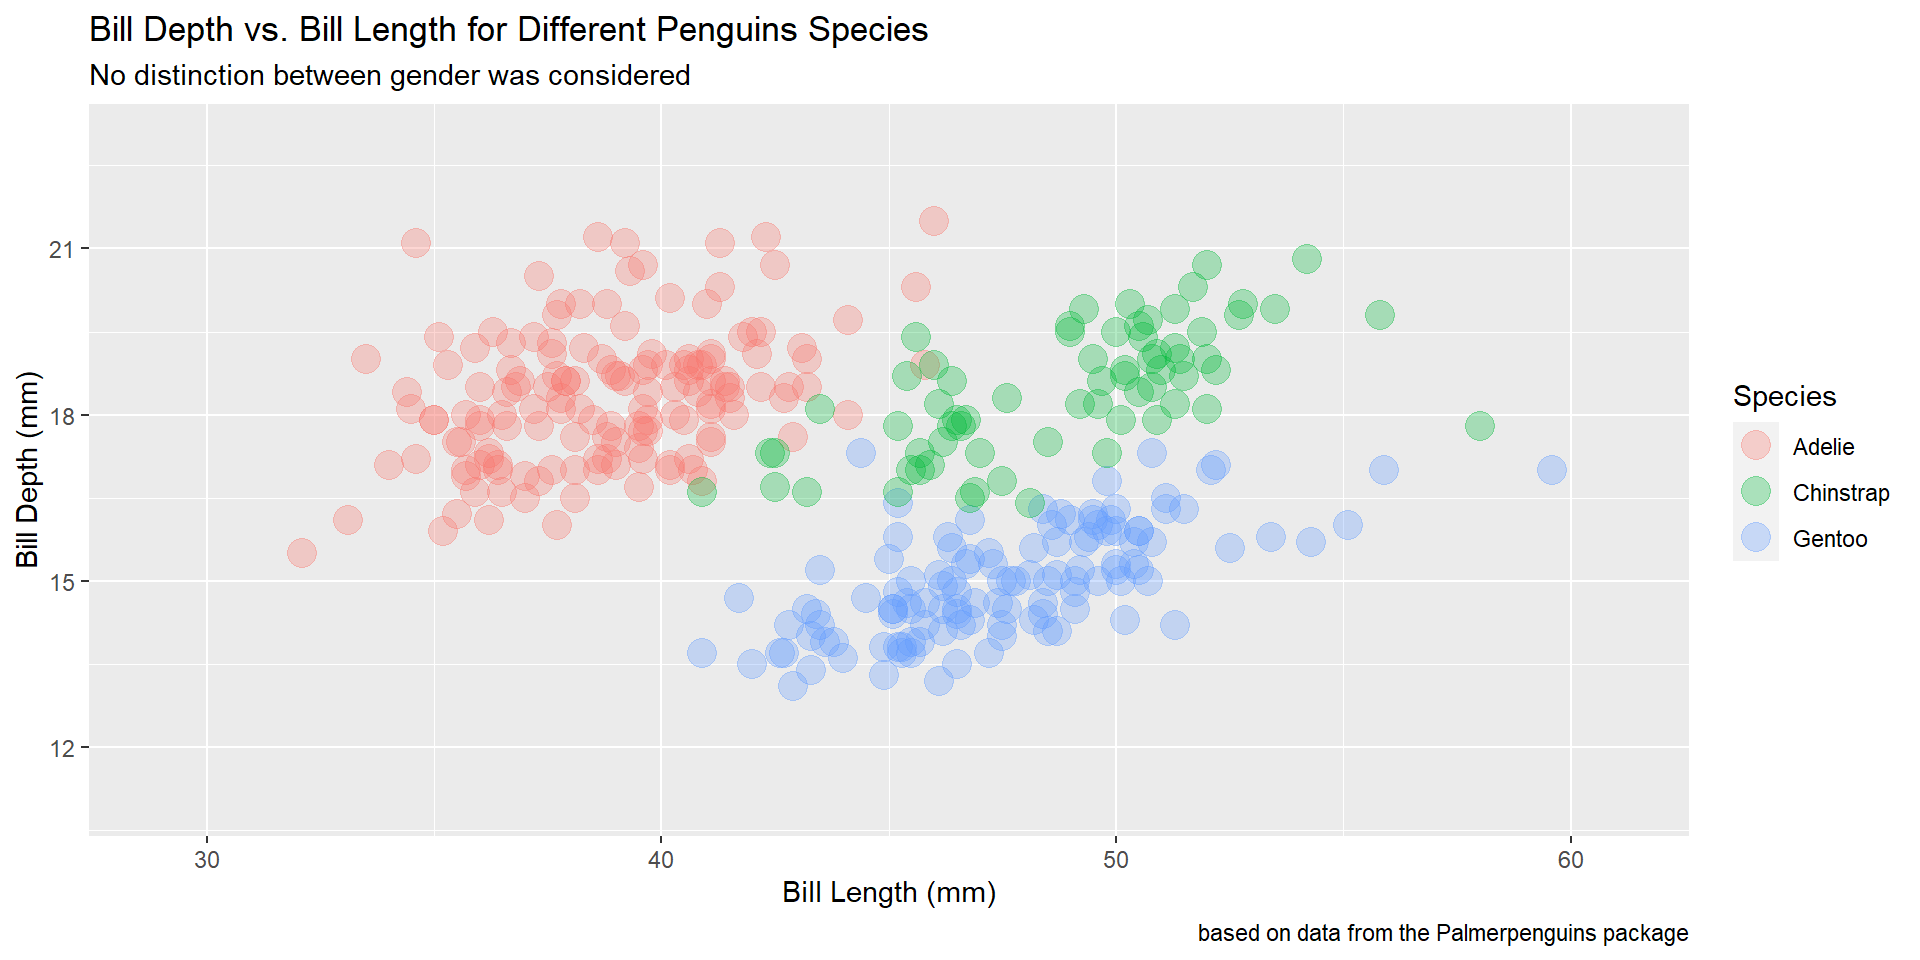
Scatter Plots
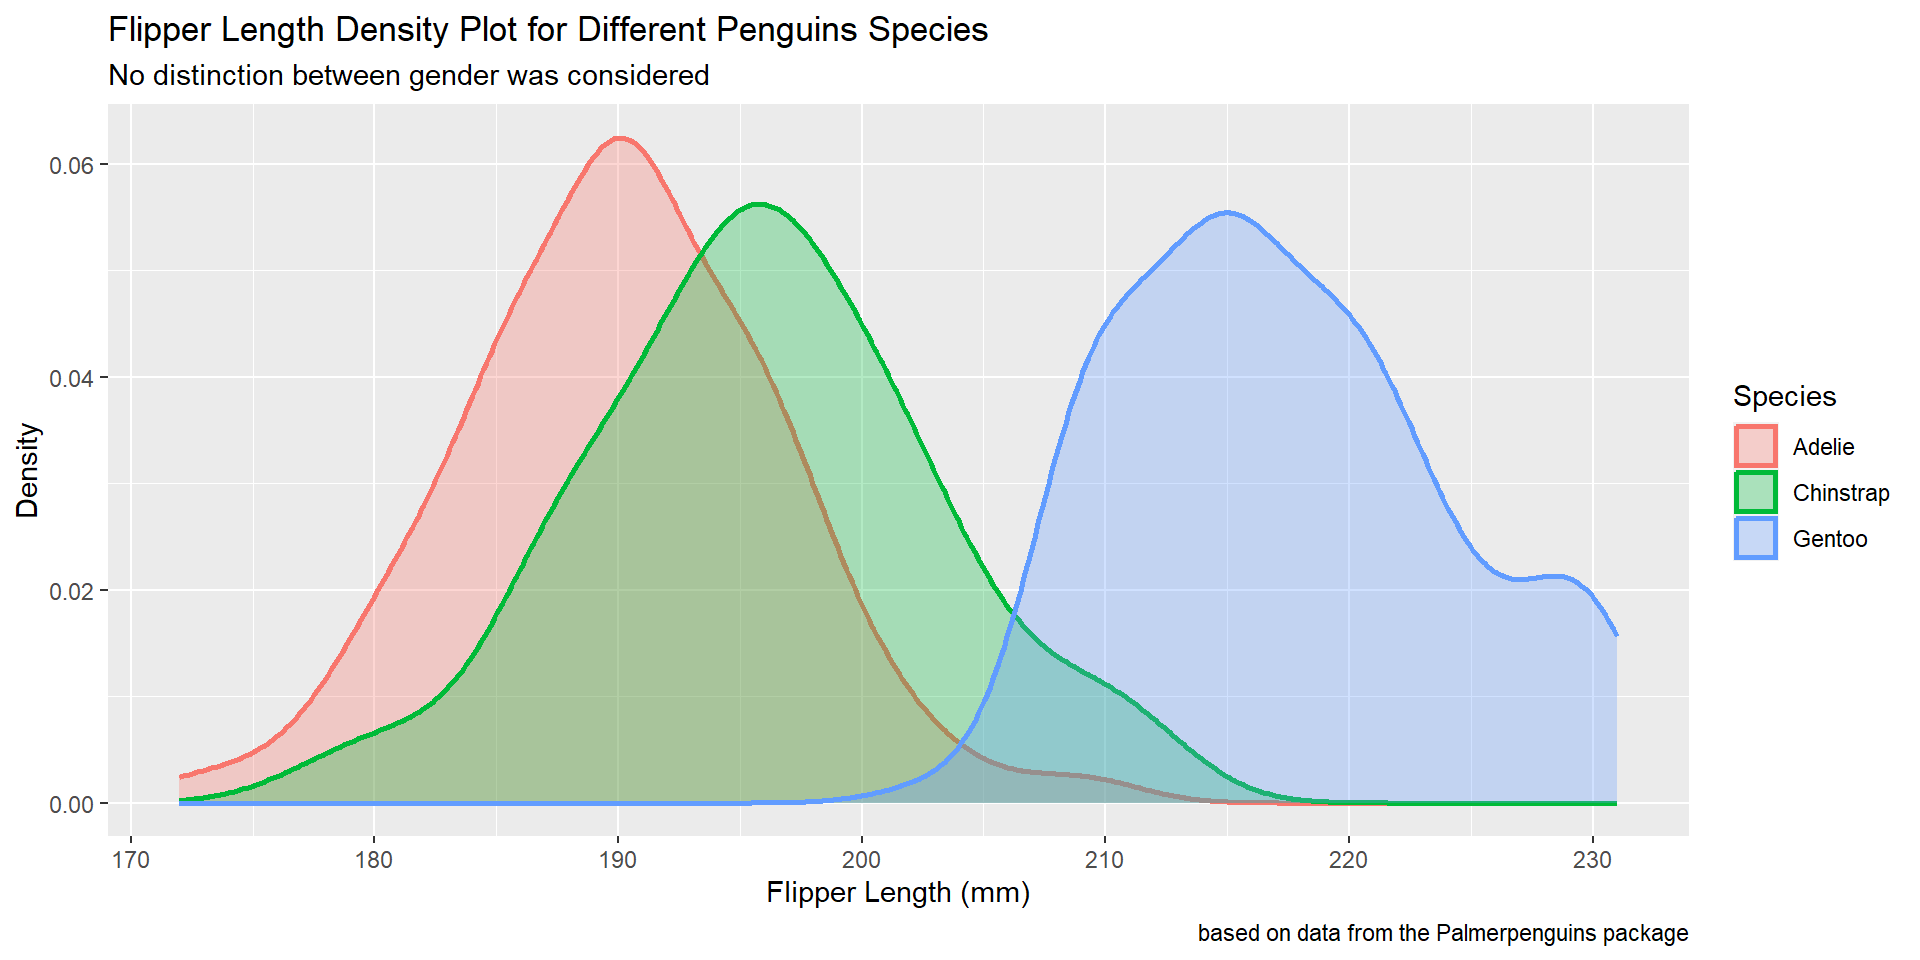
Density Plots
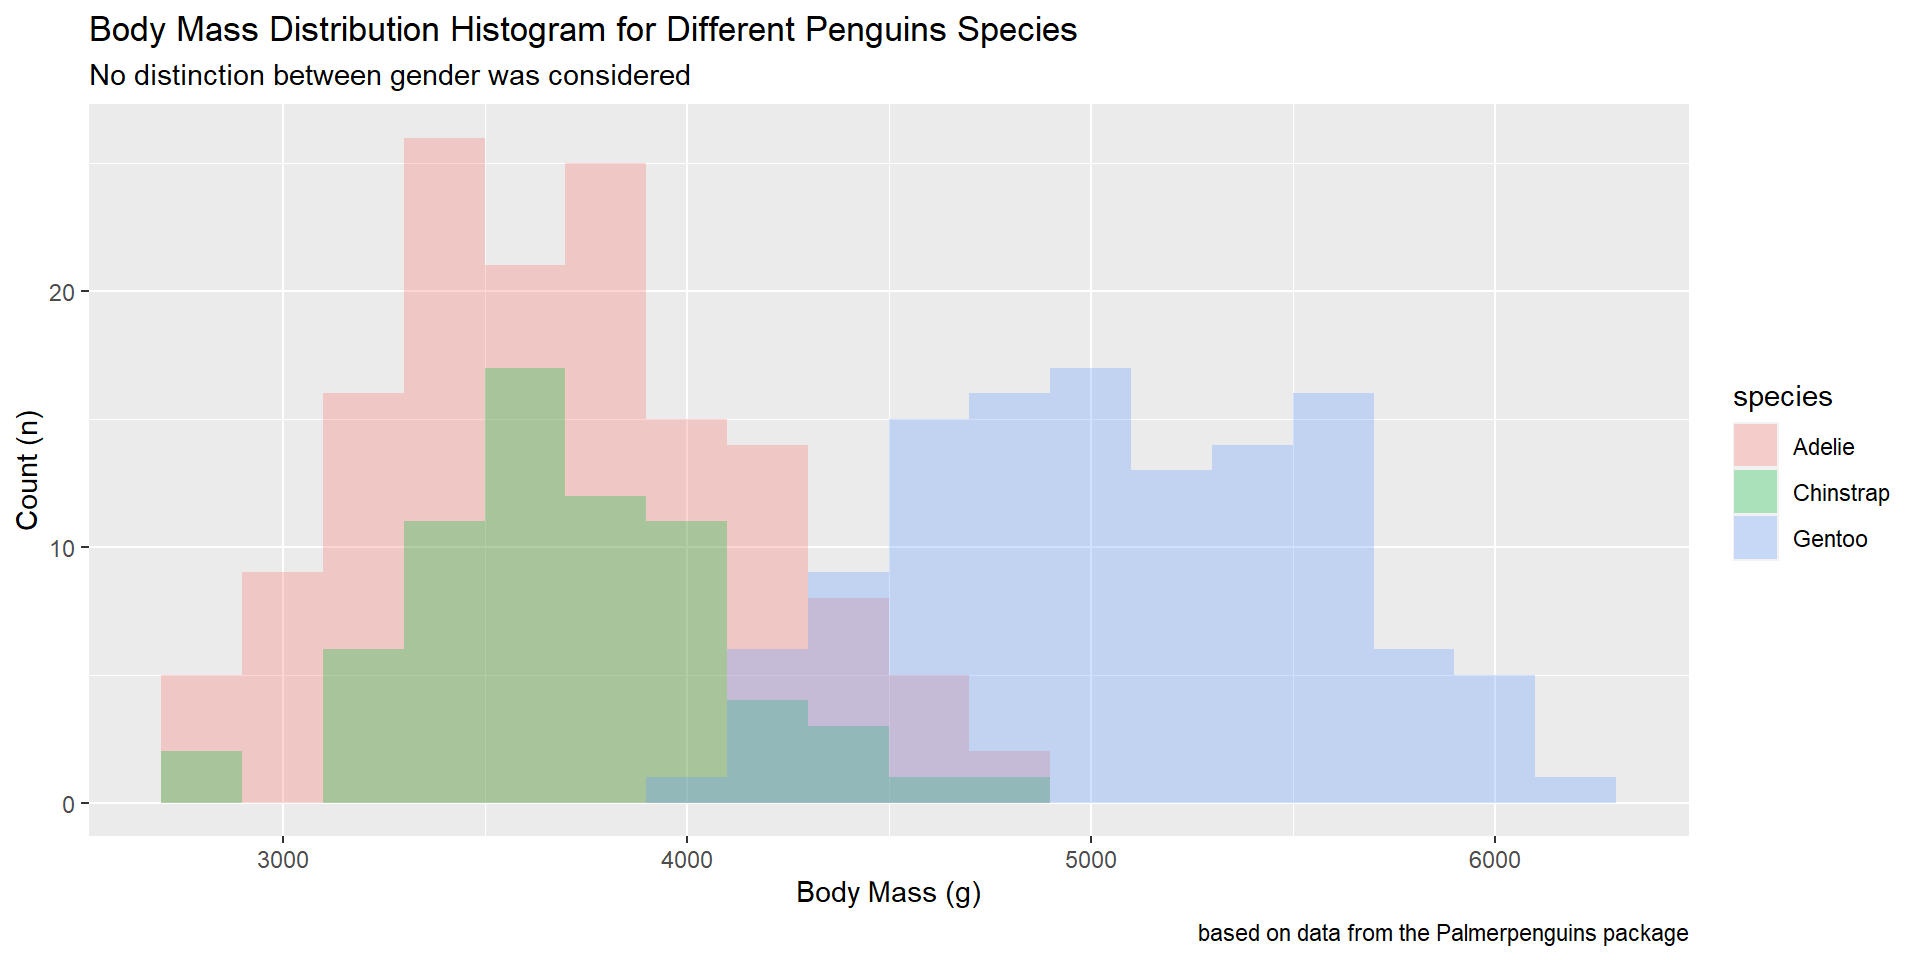
Histograms
Horizontal, Vertical, and Diagonal Lines
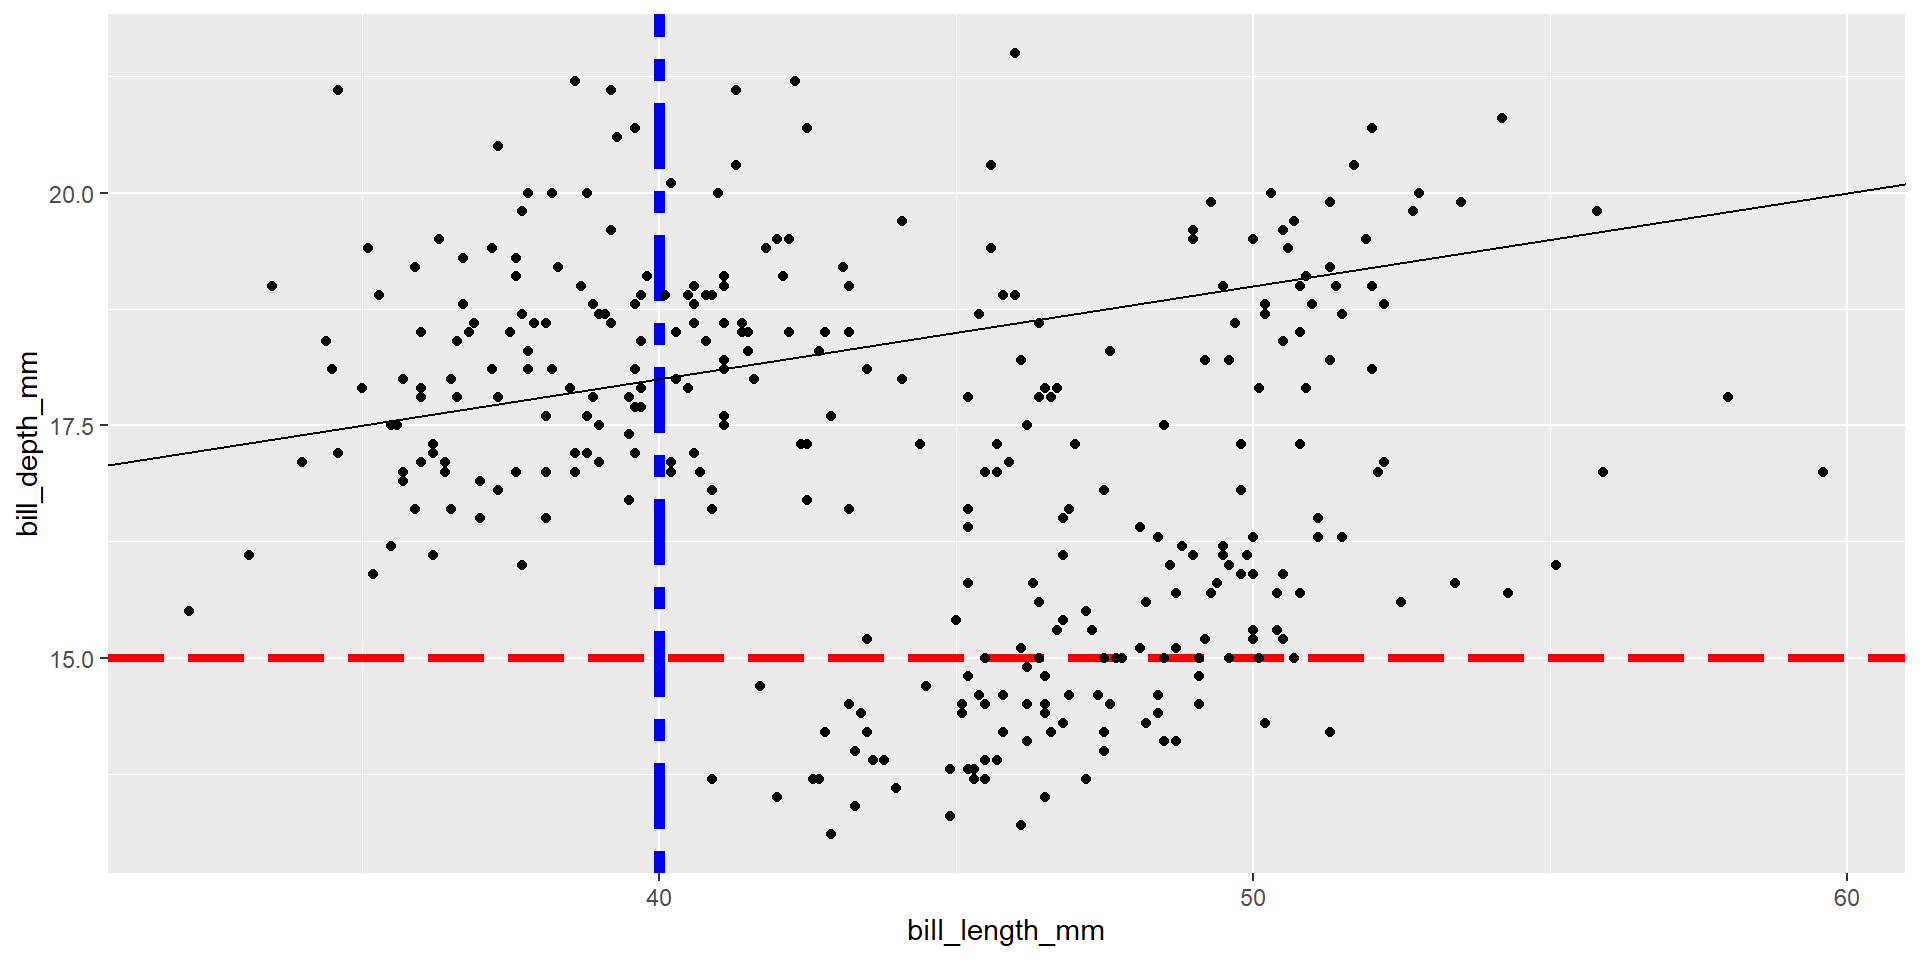
Line Types
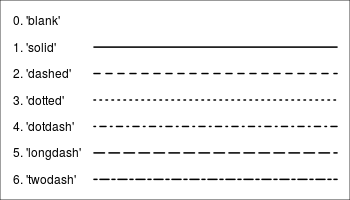
Lines Using Statistics
Add a line passing through the median of each variable.
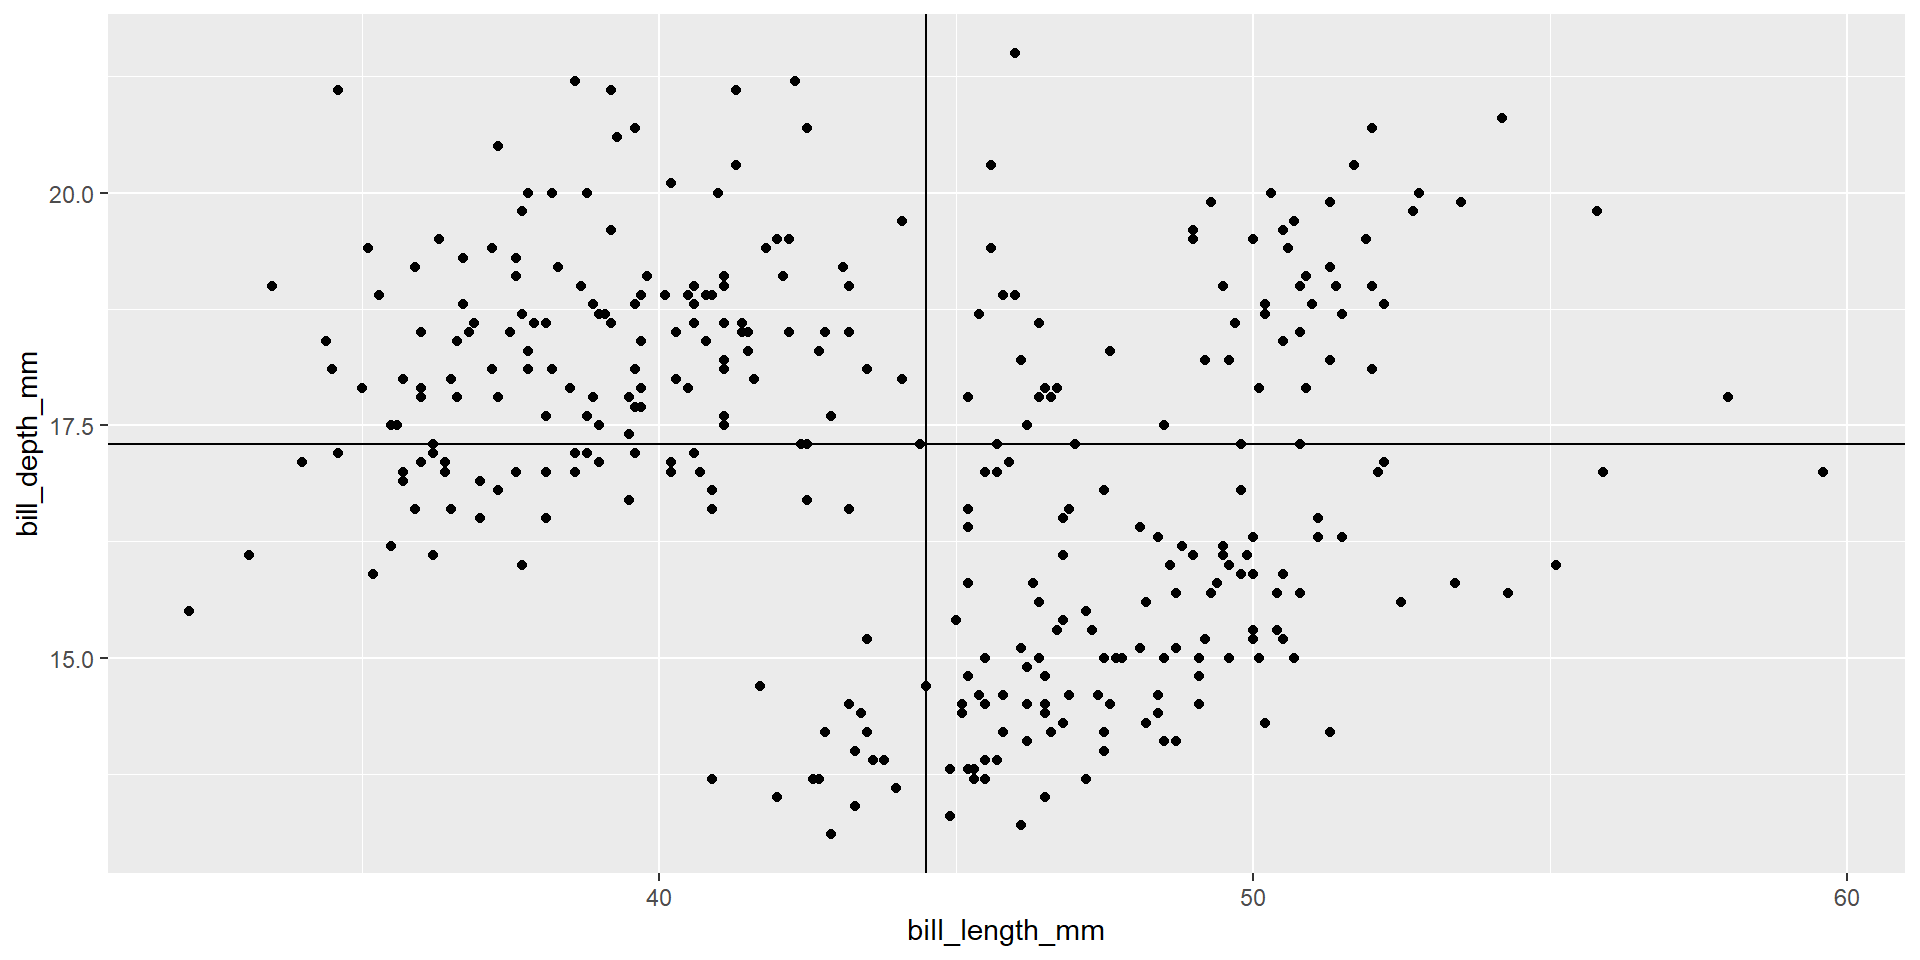
Lines by Group
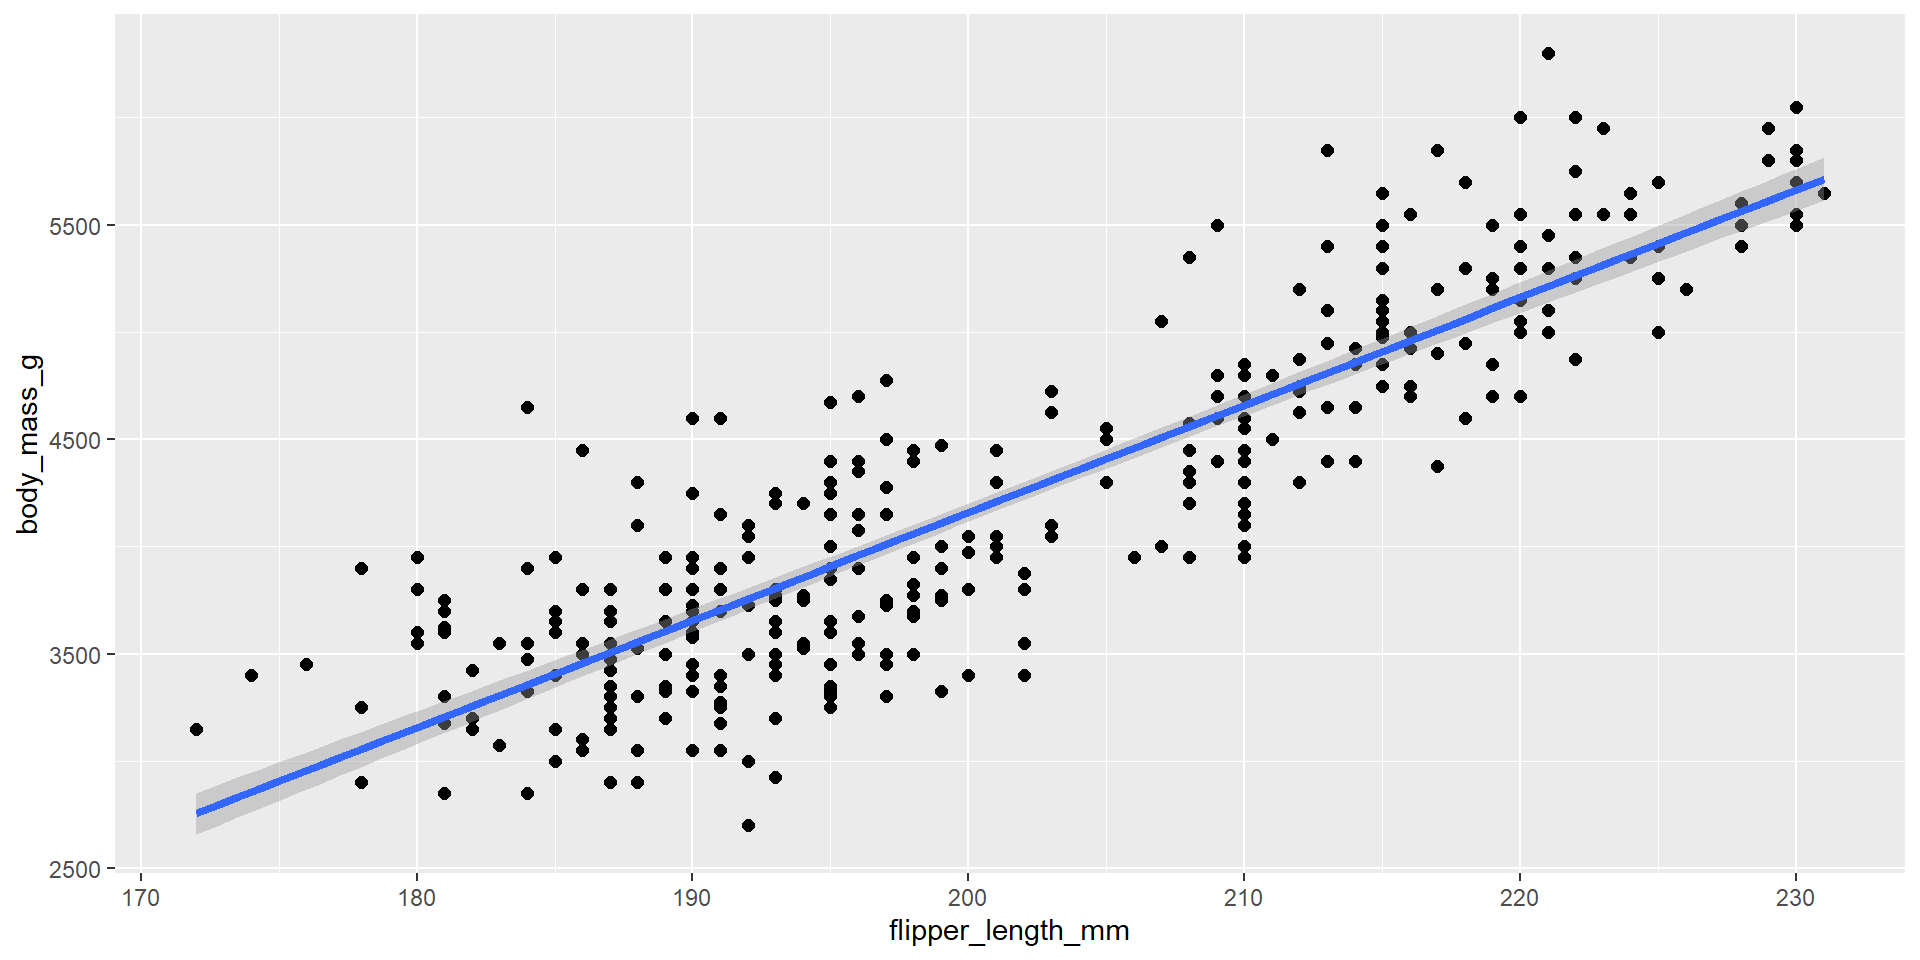
Regression Line
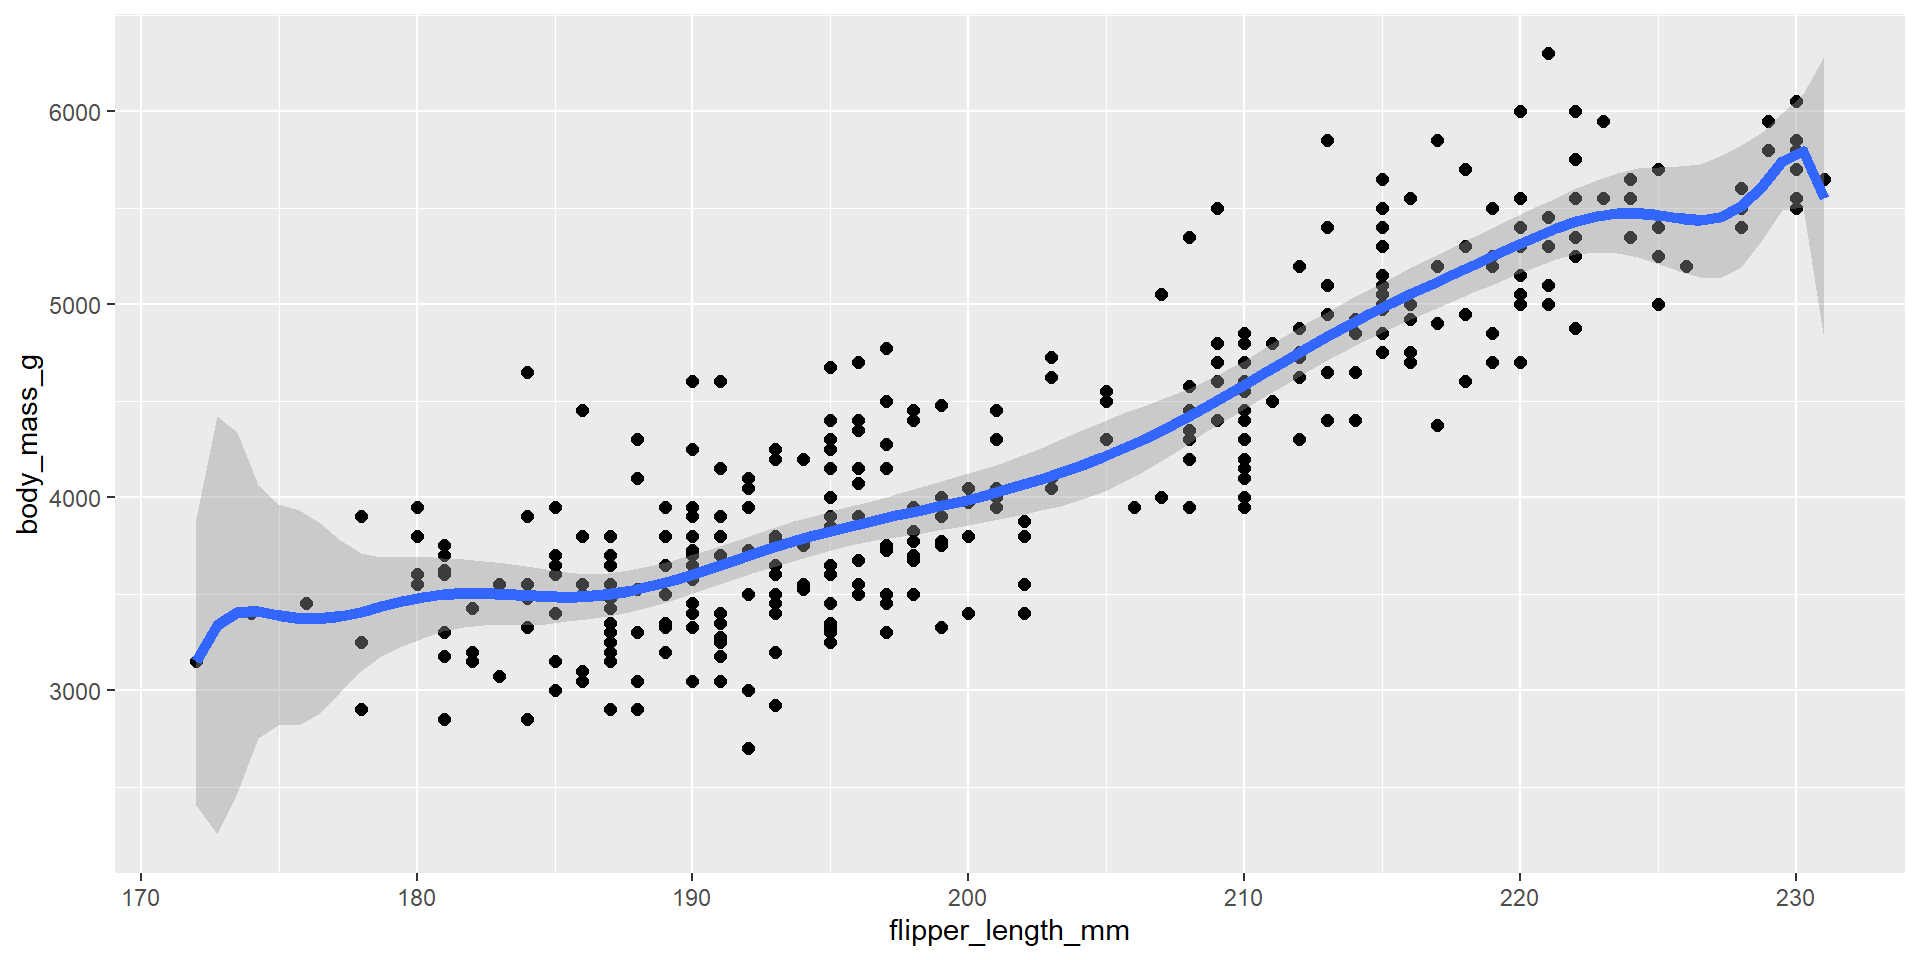
Polynomial Regression
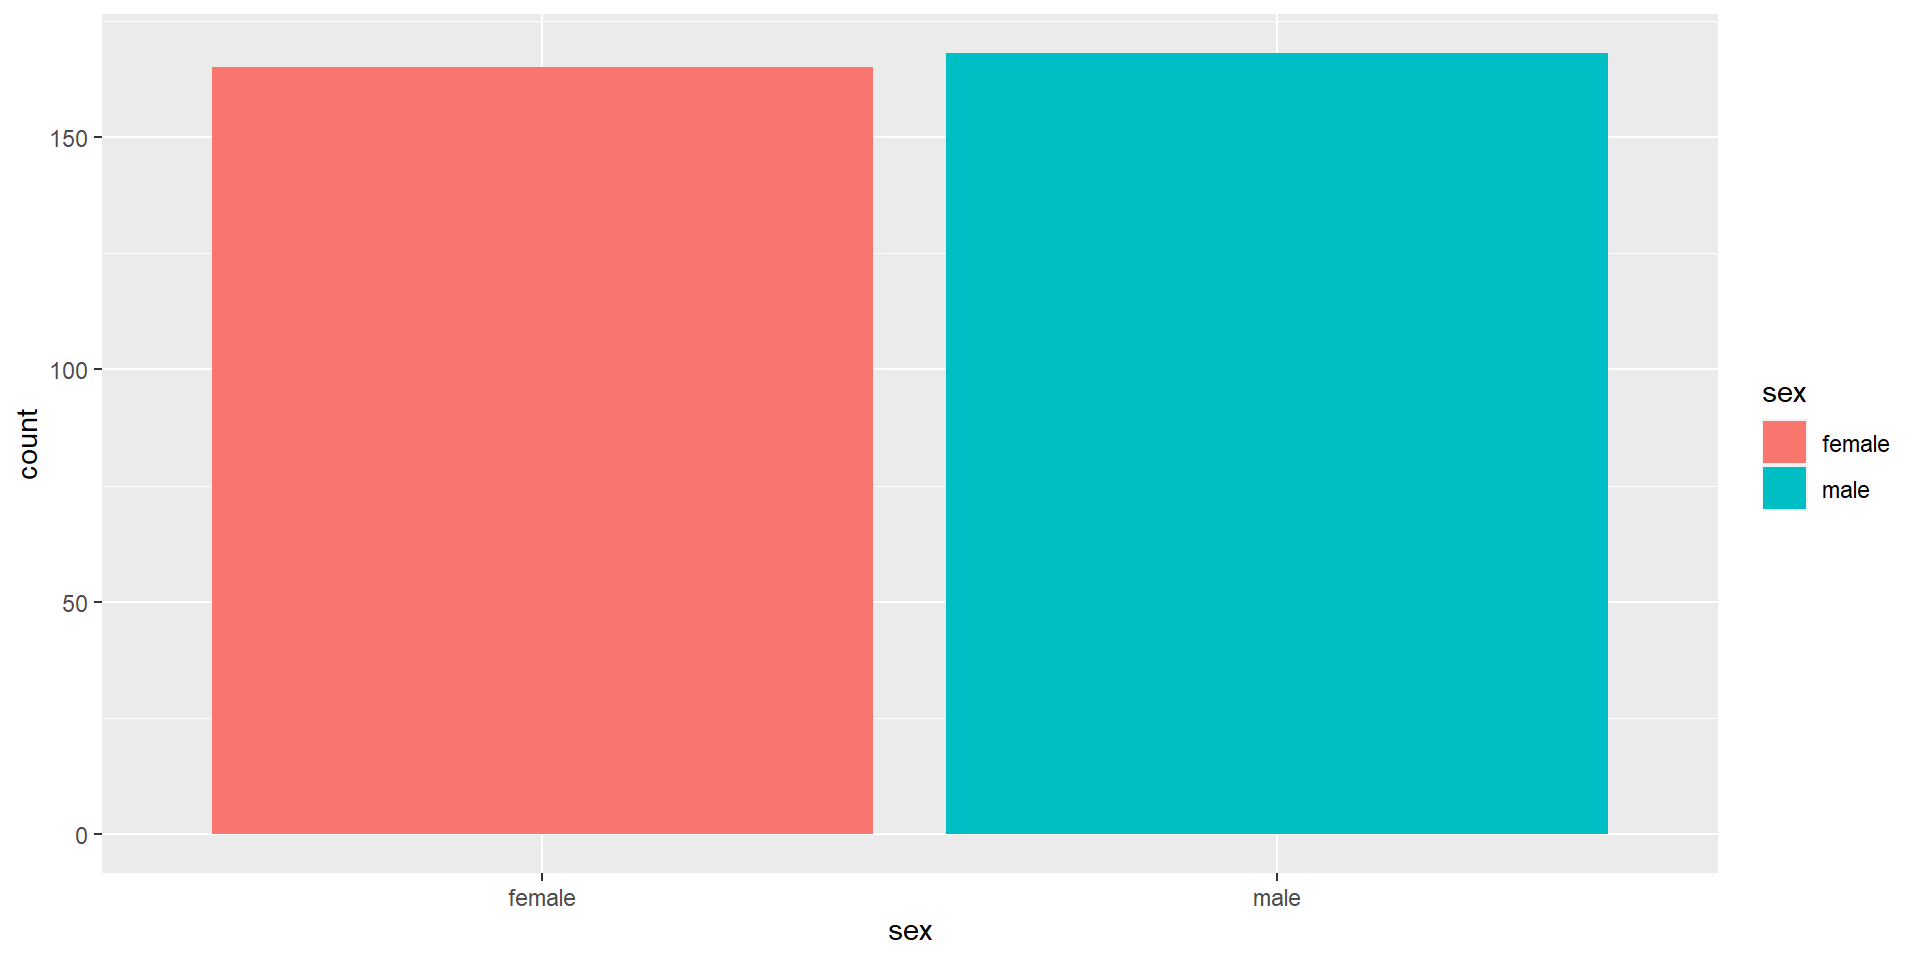
Bar Charts
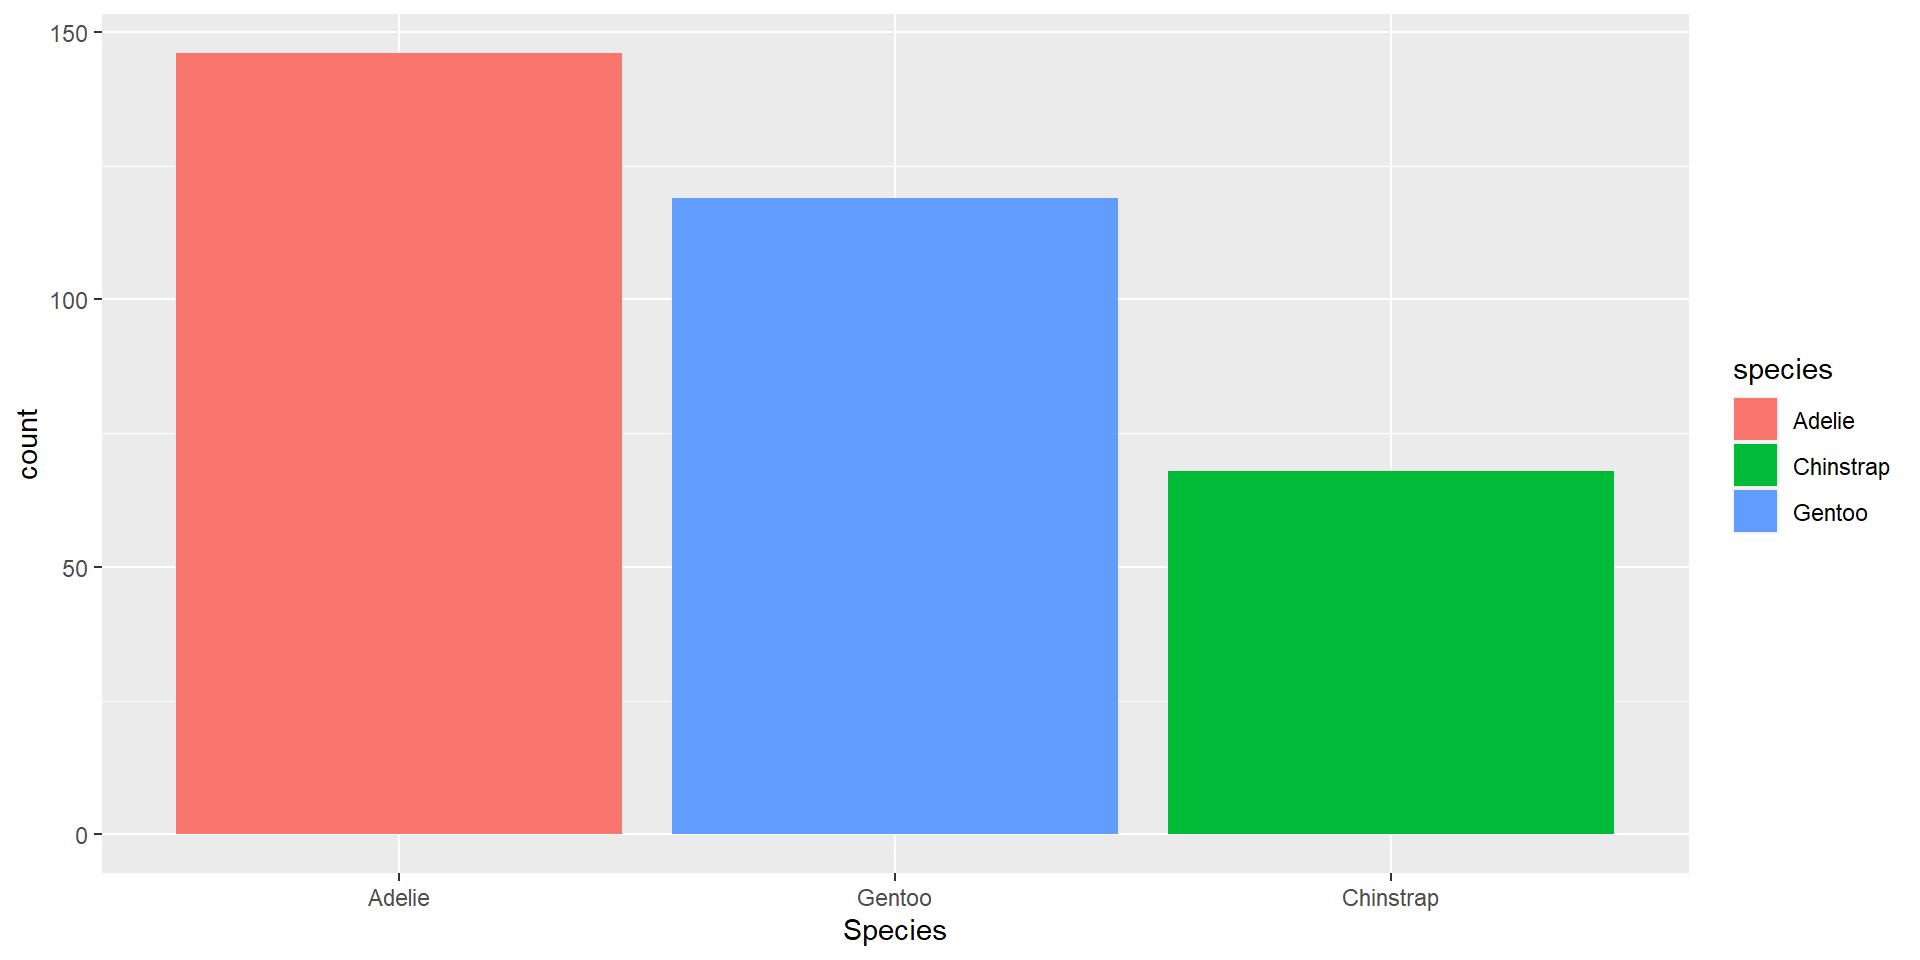
Bar Charts, Reordering Factors
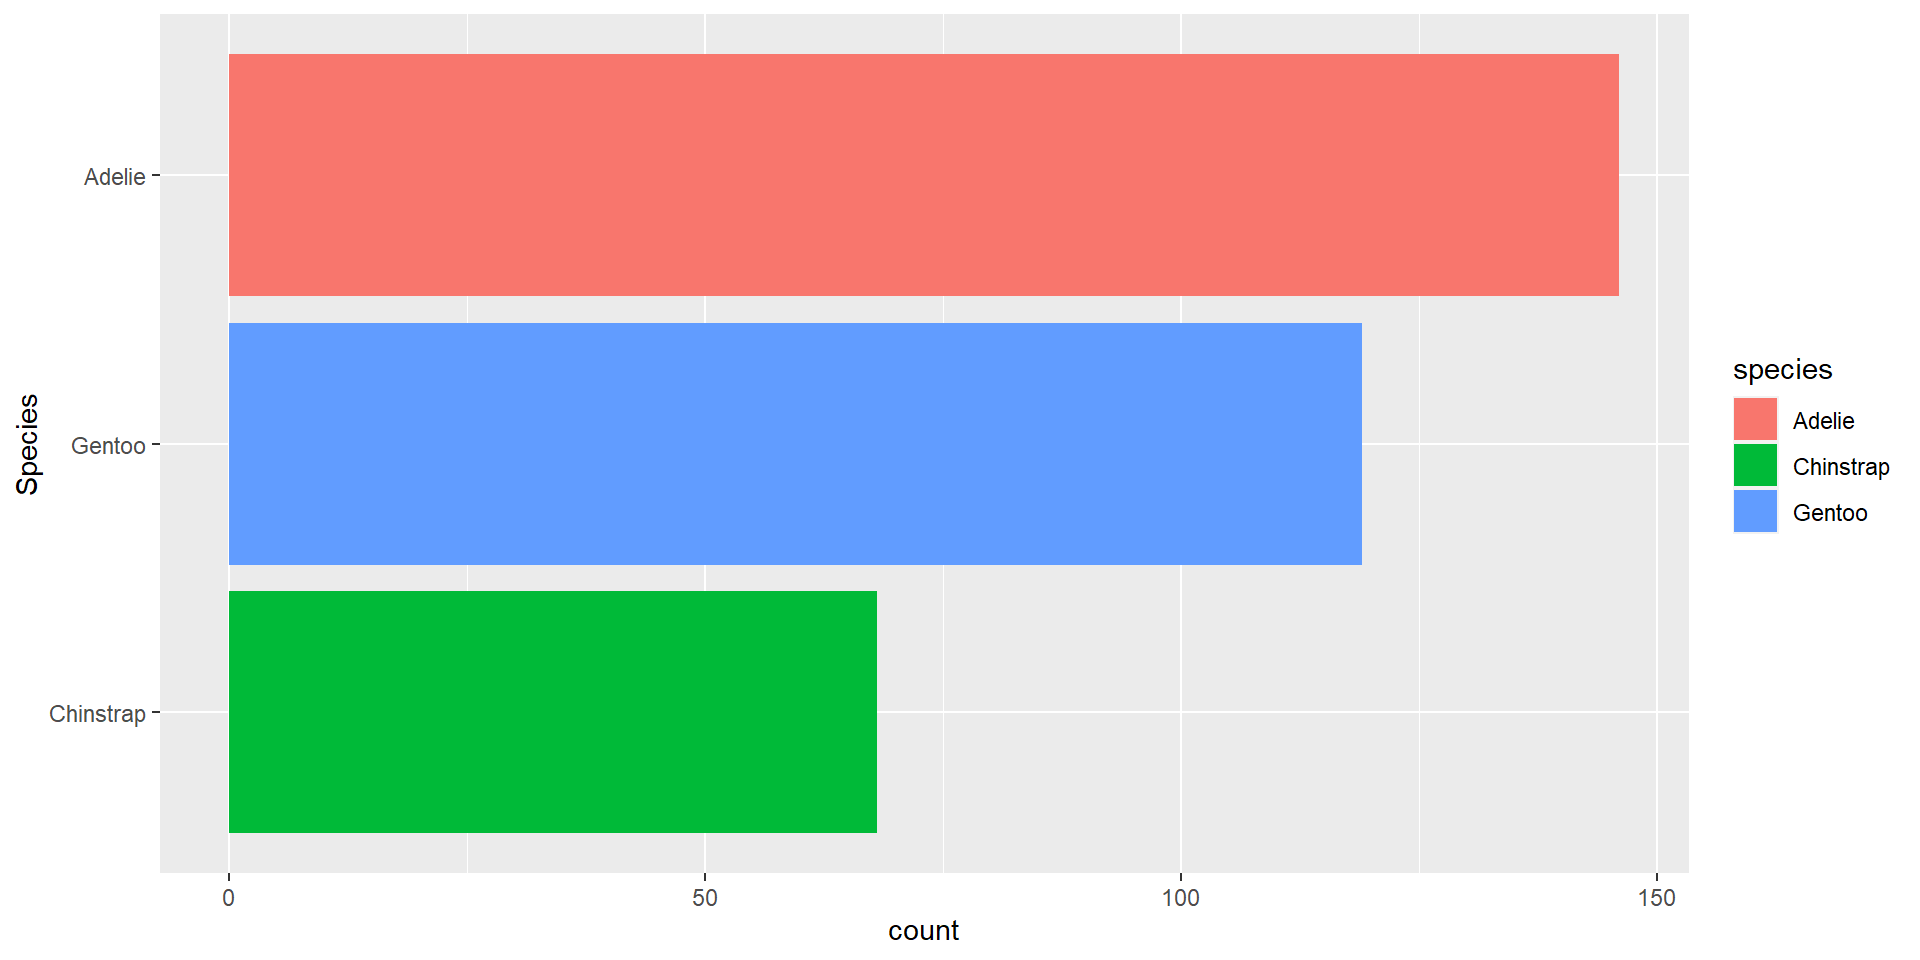
Flipped Bar Charts
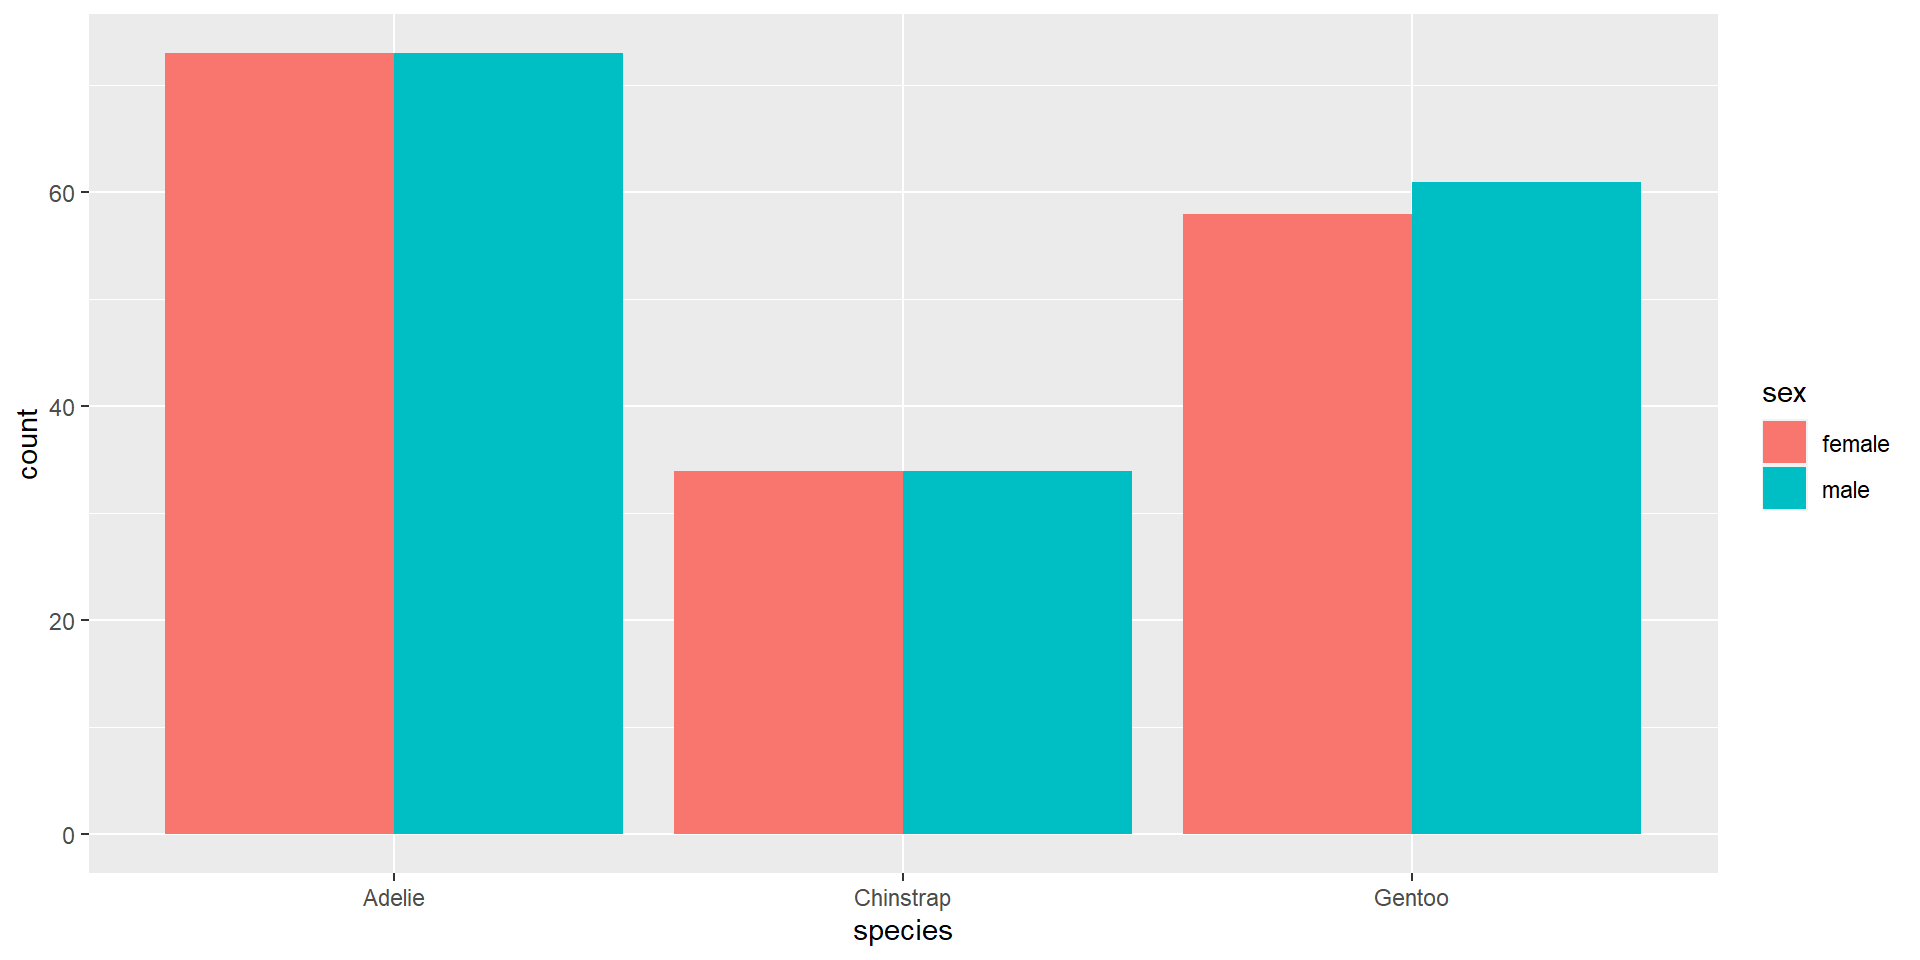
Grouped Bar Charts
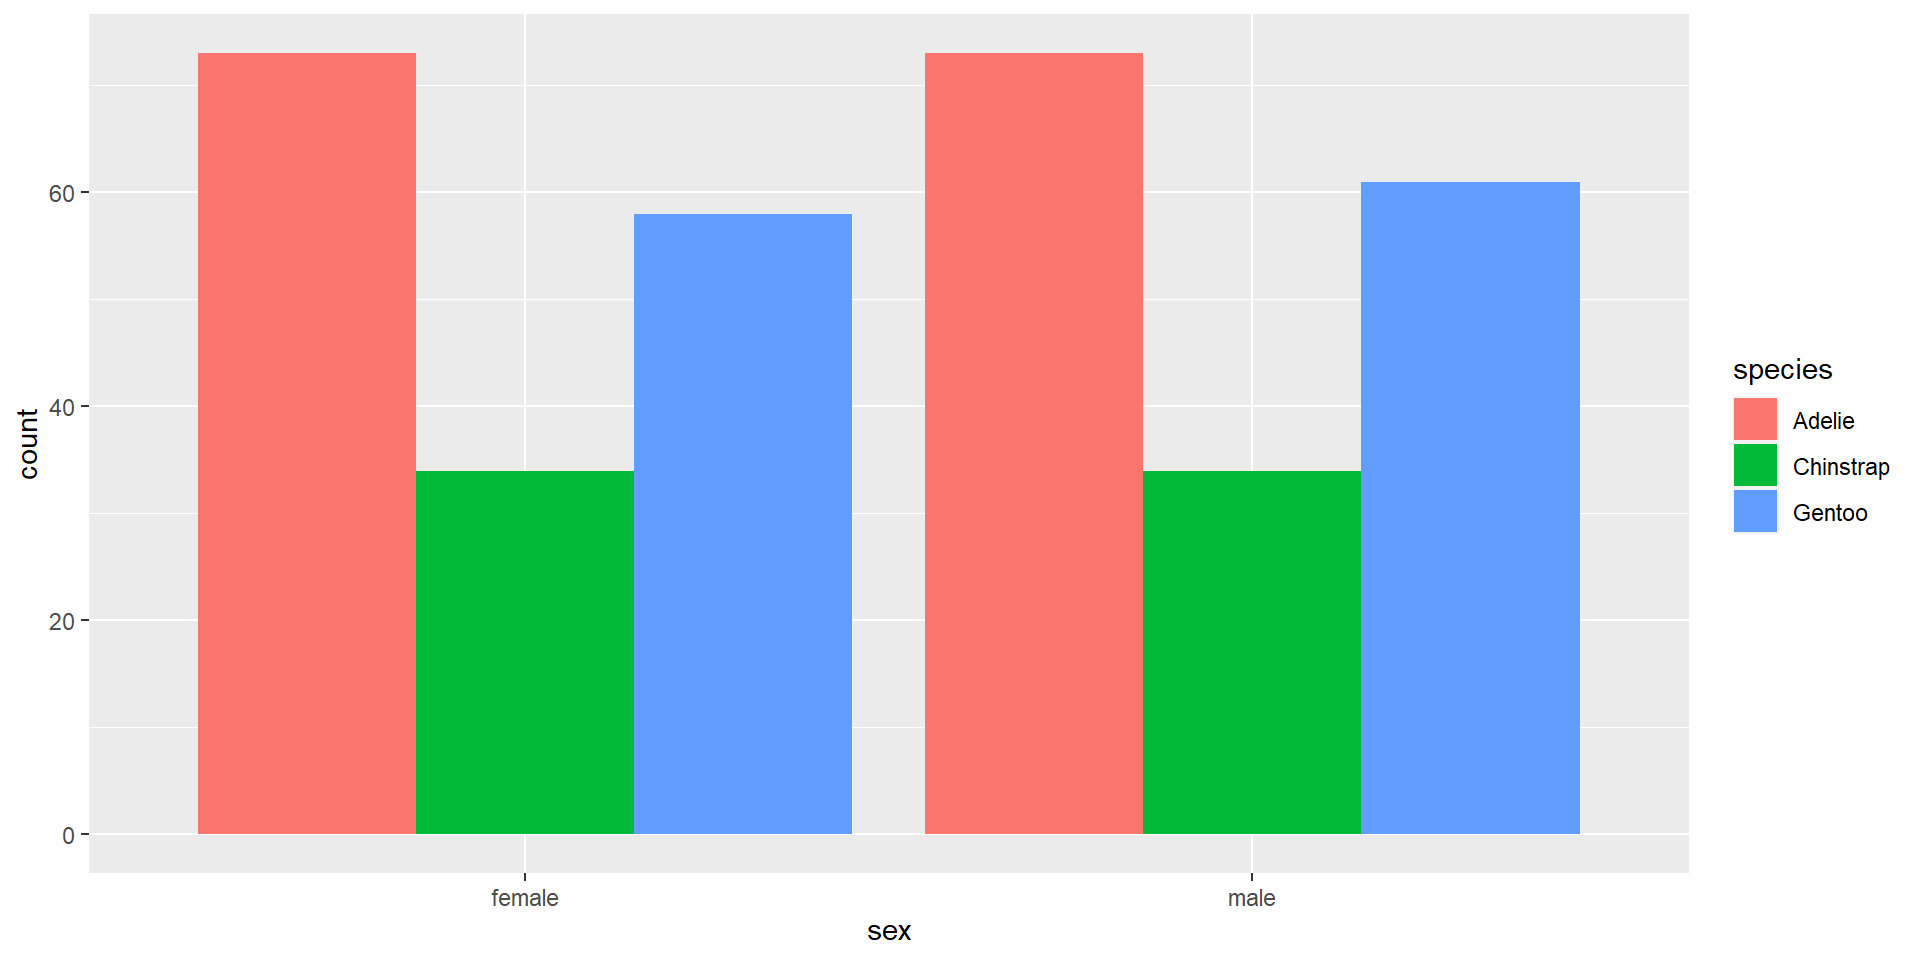
Grouped Bar Charts 2
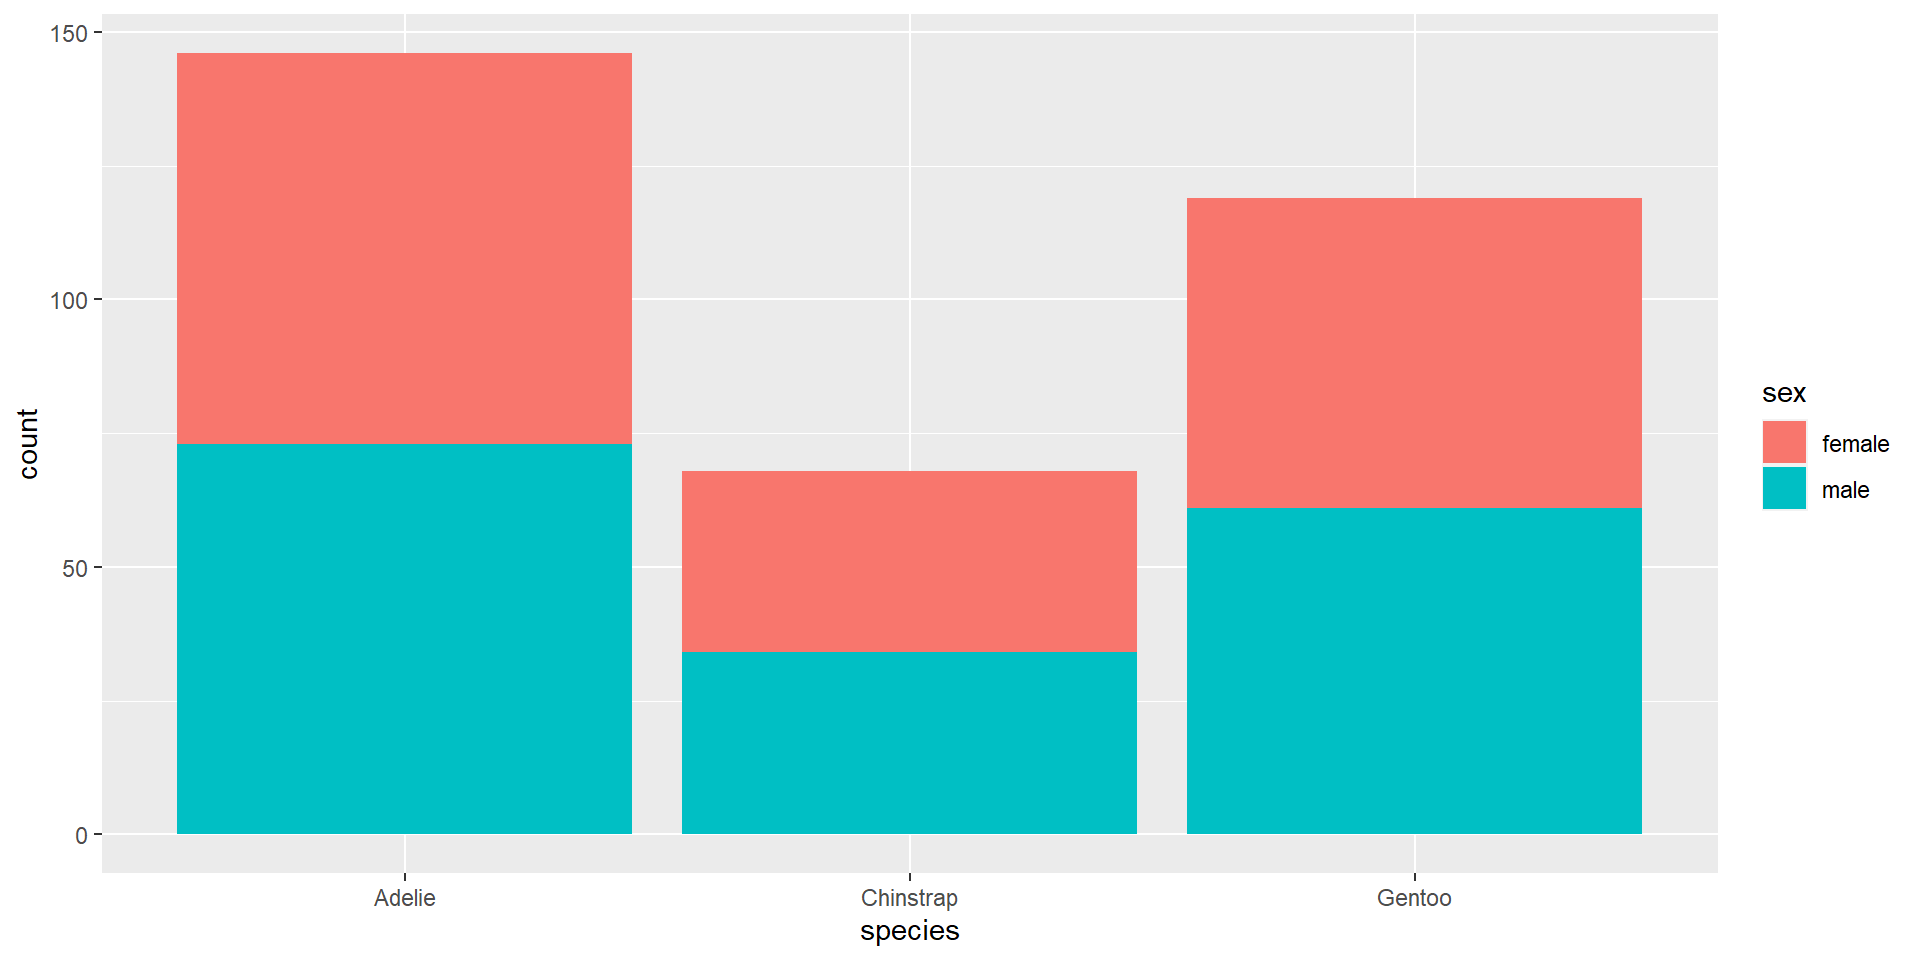
Stacked Bar Charts
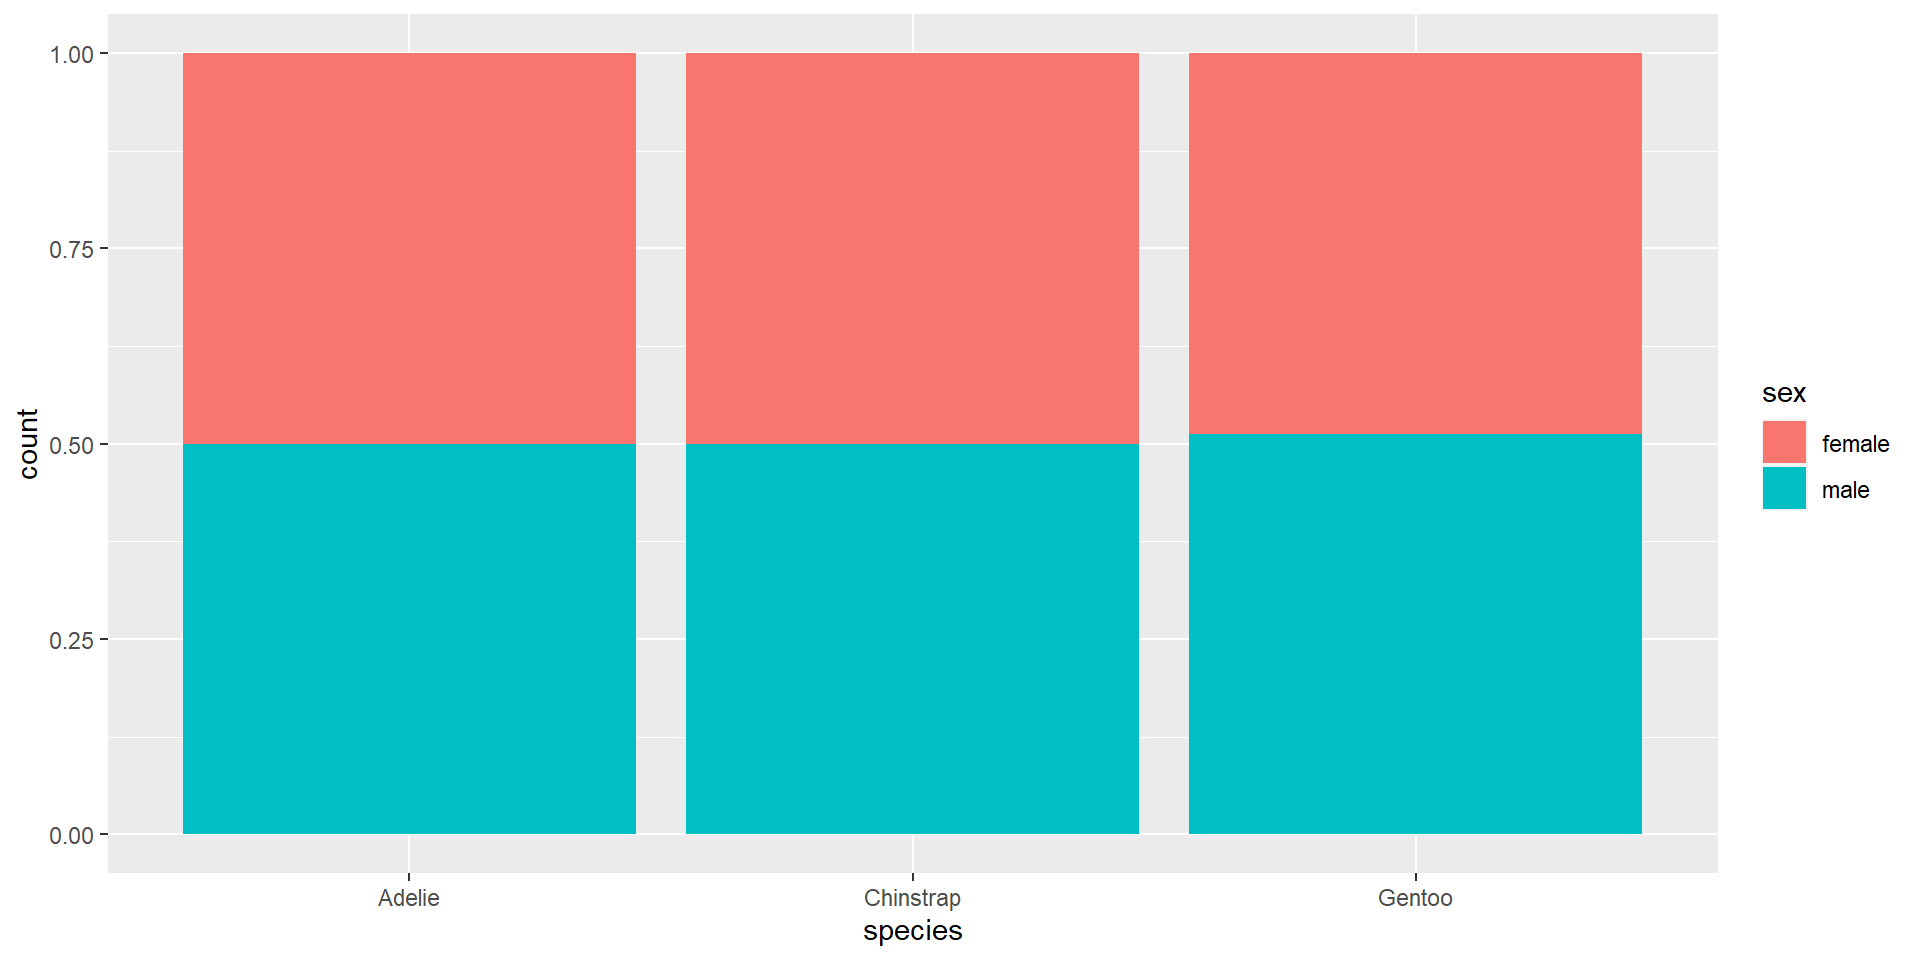
Percent Stacked Bar Charts
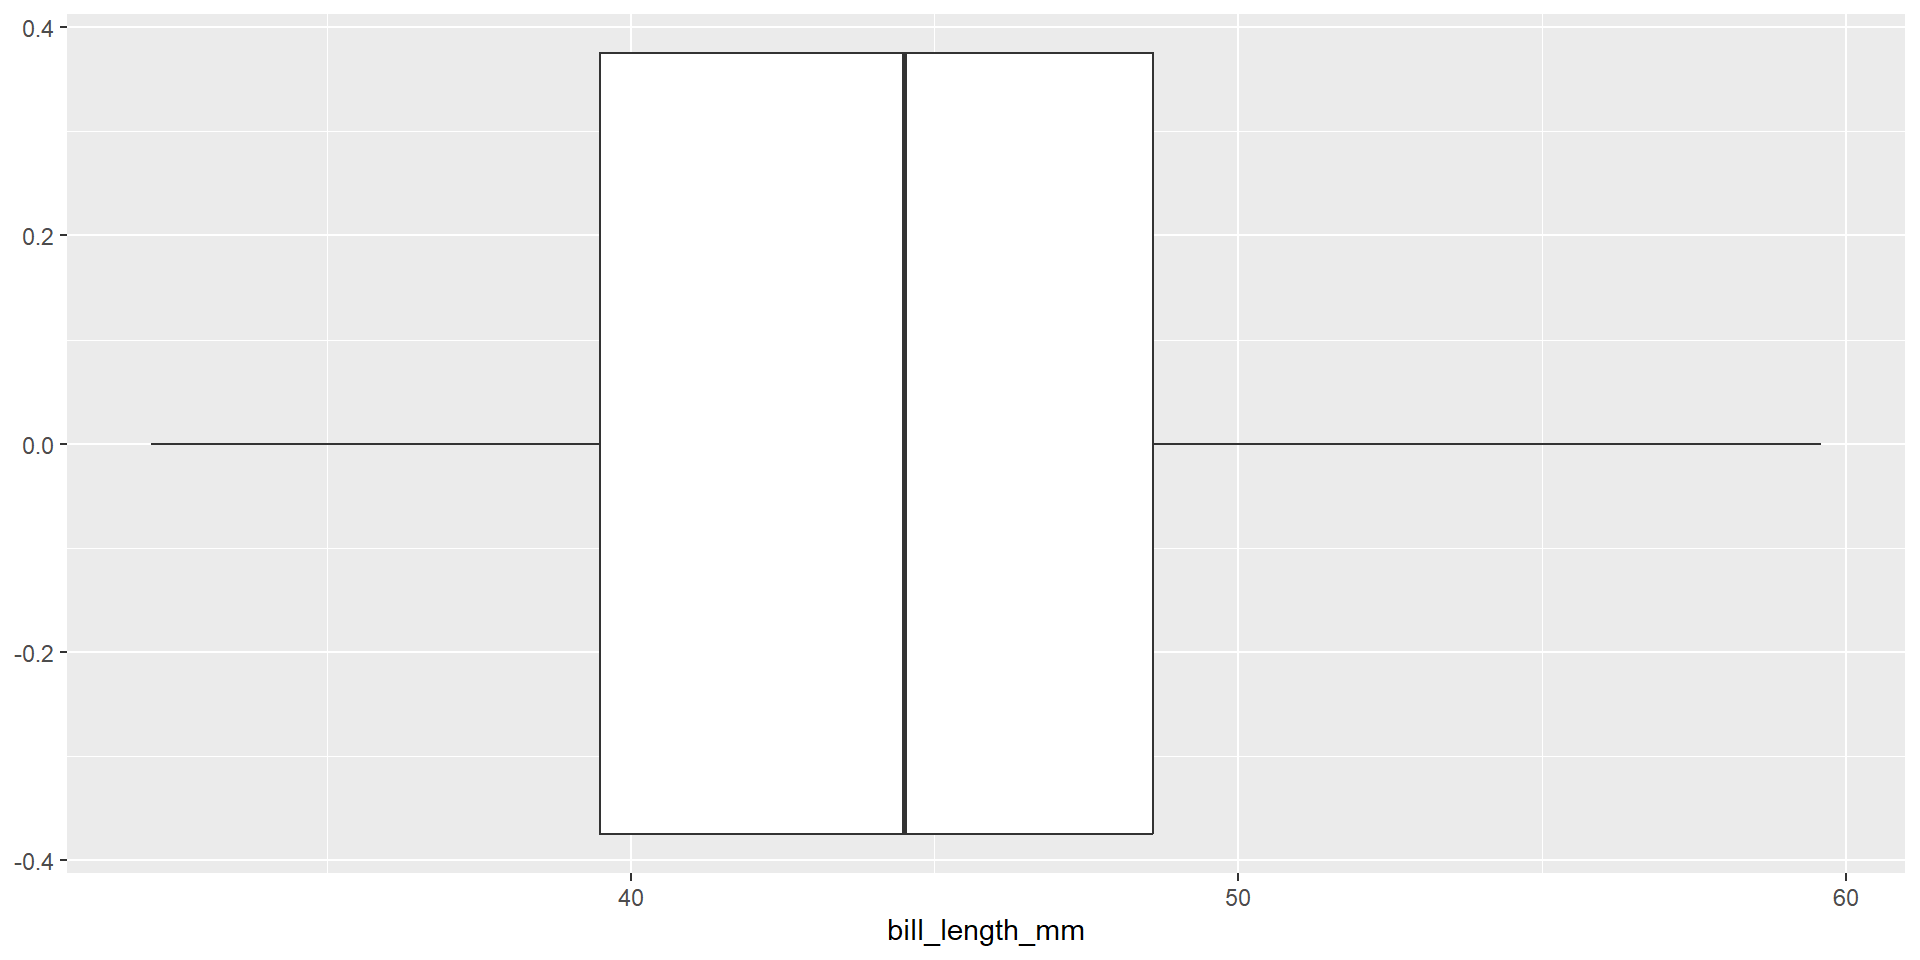
Basic Box Plot
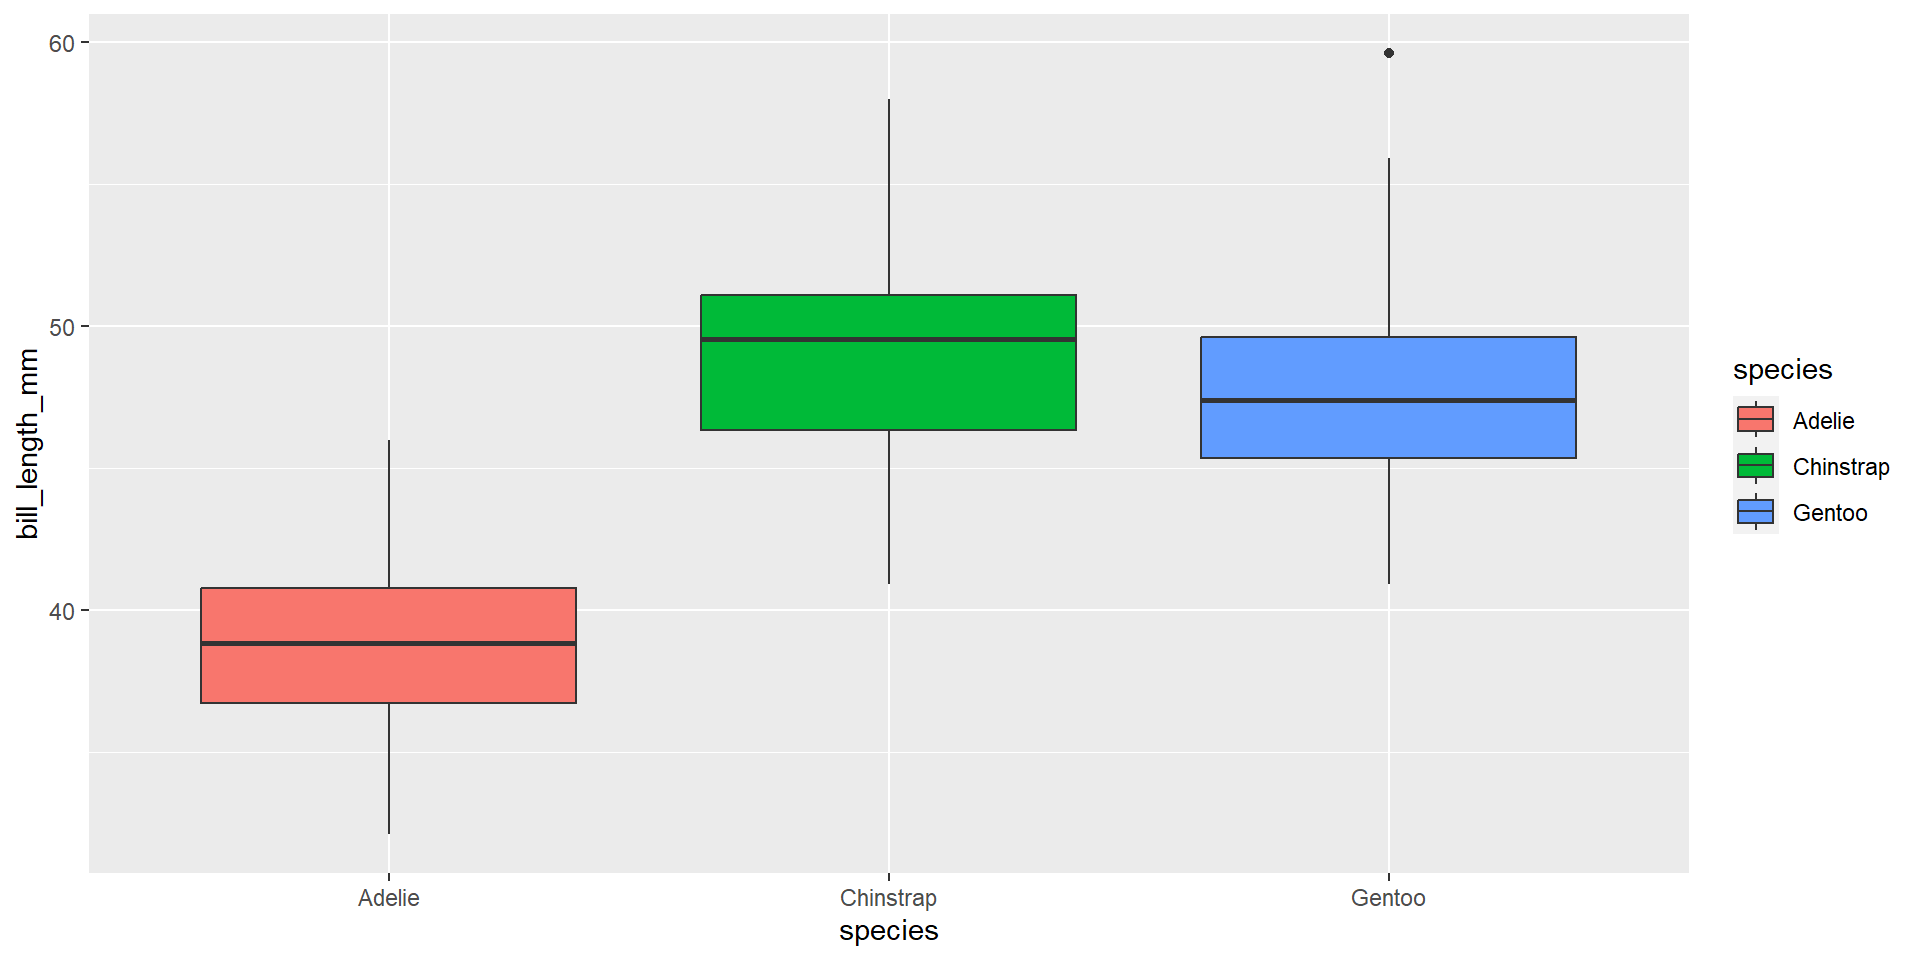
Box Plot for Different Categories
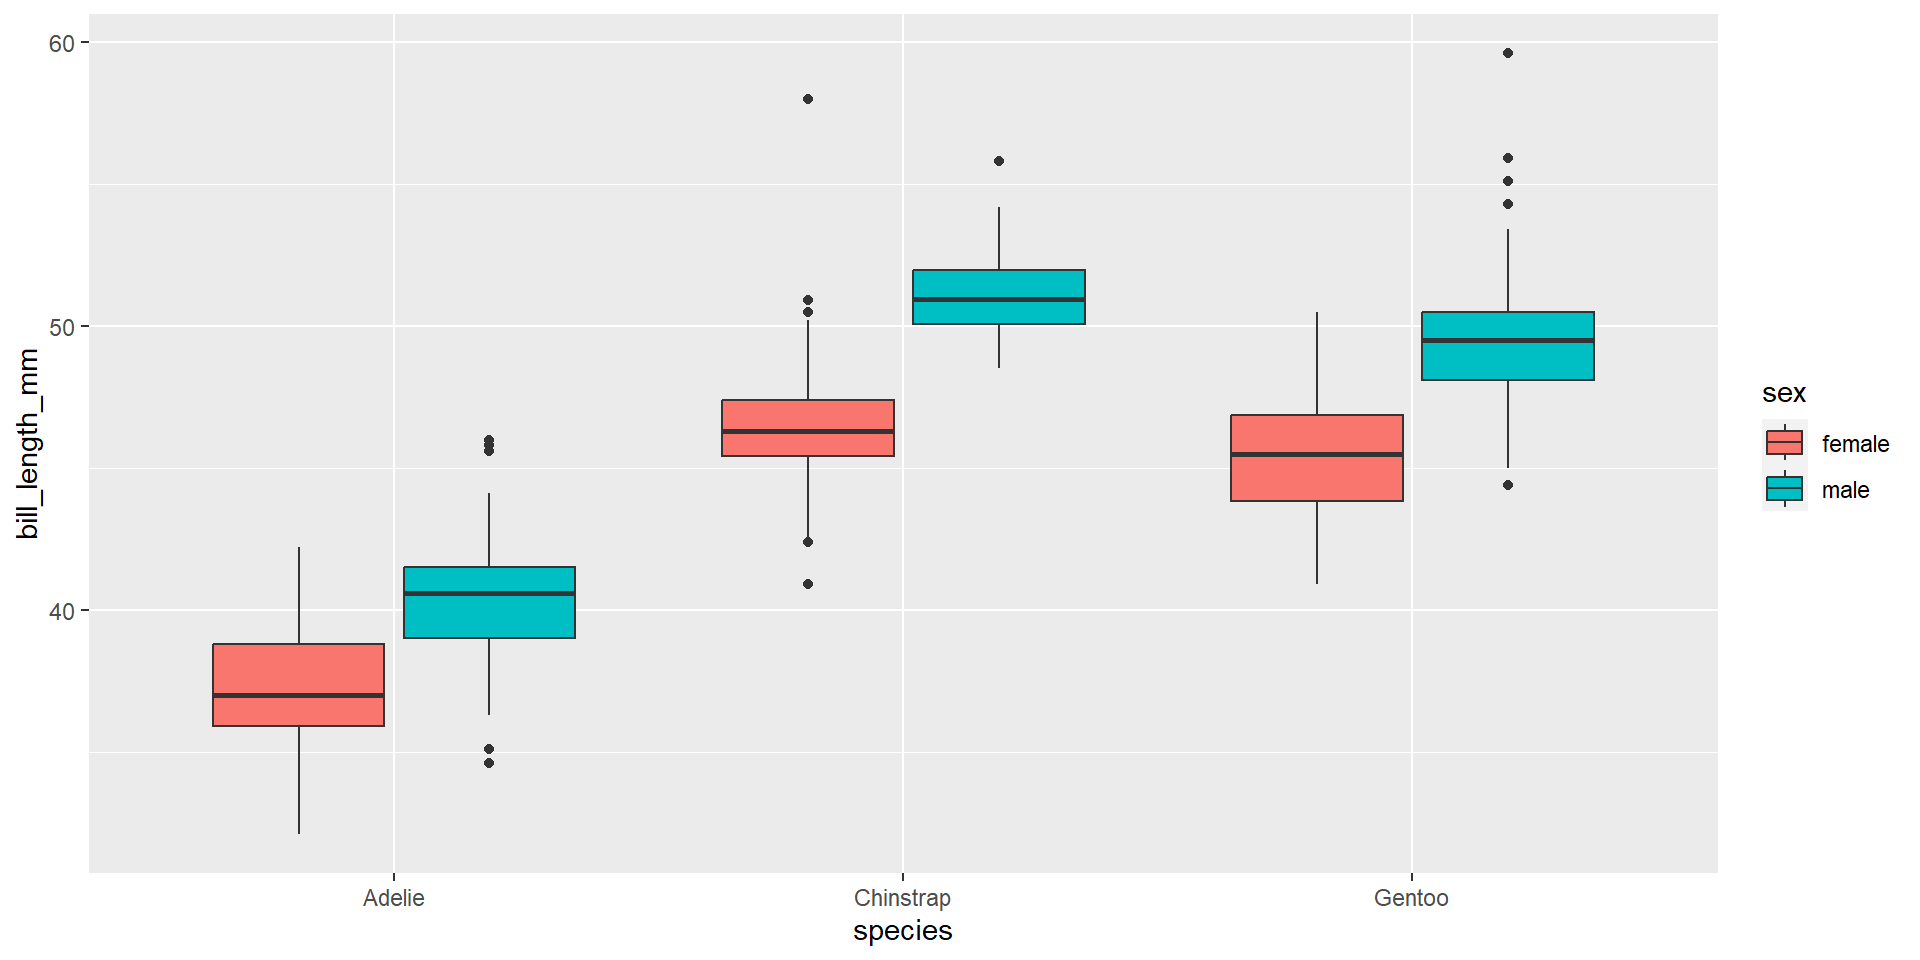
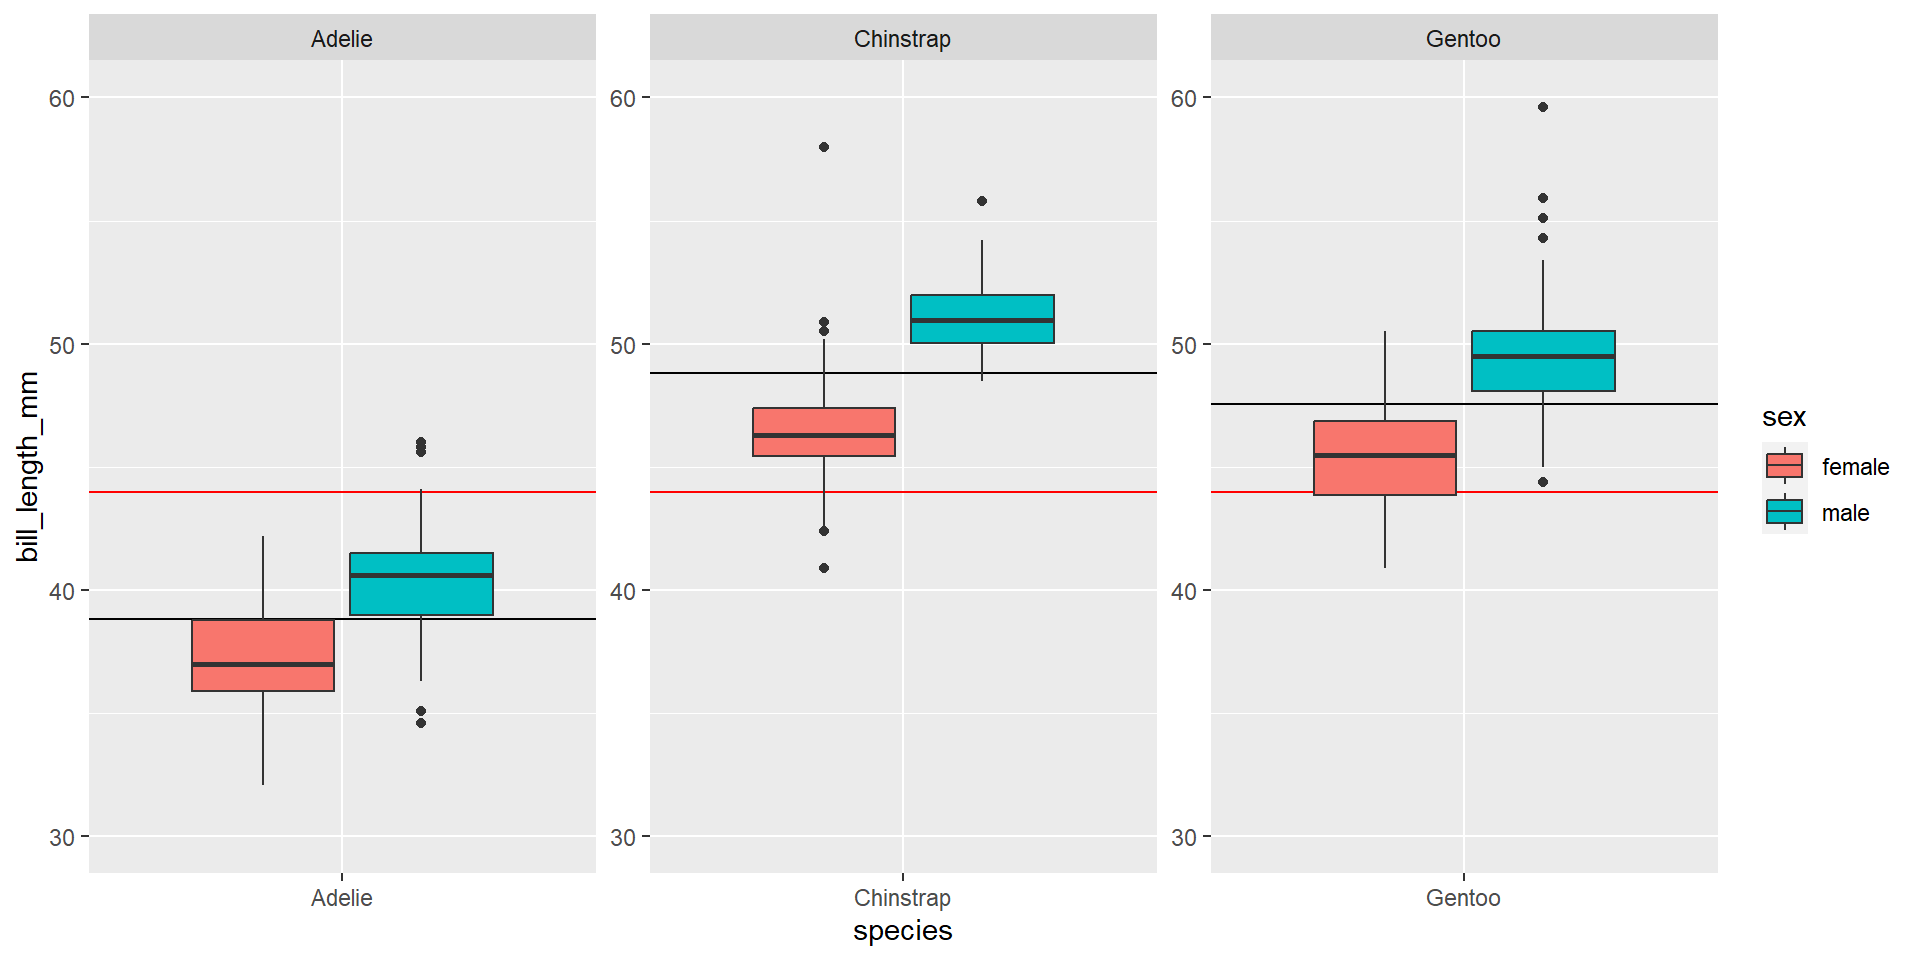
Grouped Box Plot for Different Categories
Using Faceting
Showing Individual Observations
A not very good result can be obtained using geom_point.
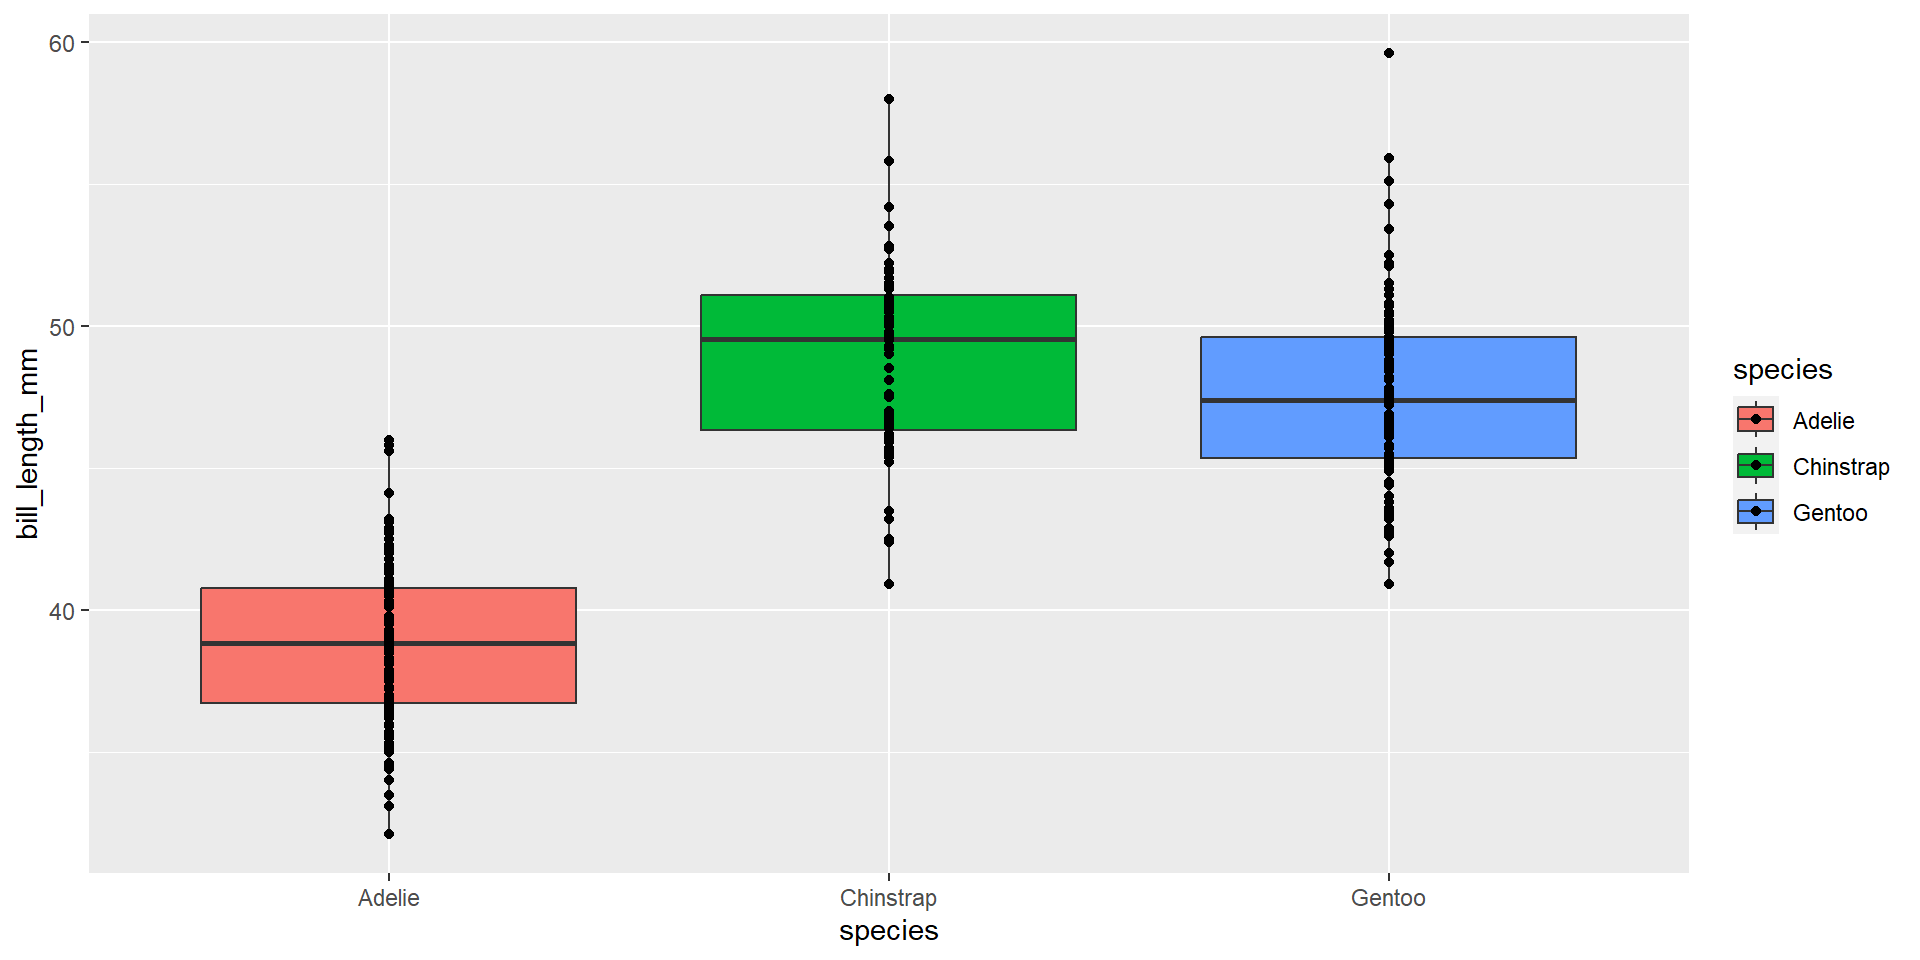
Showing Individual Observations Better

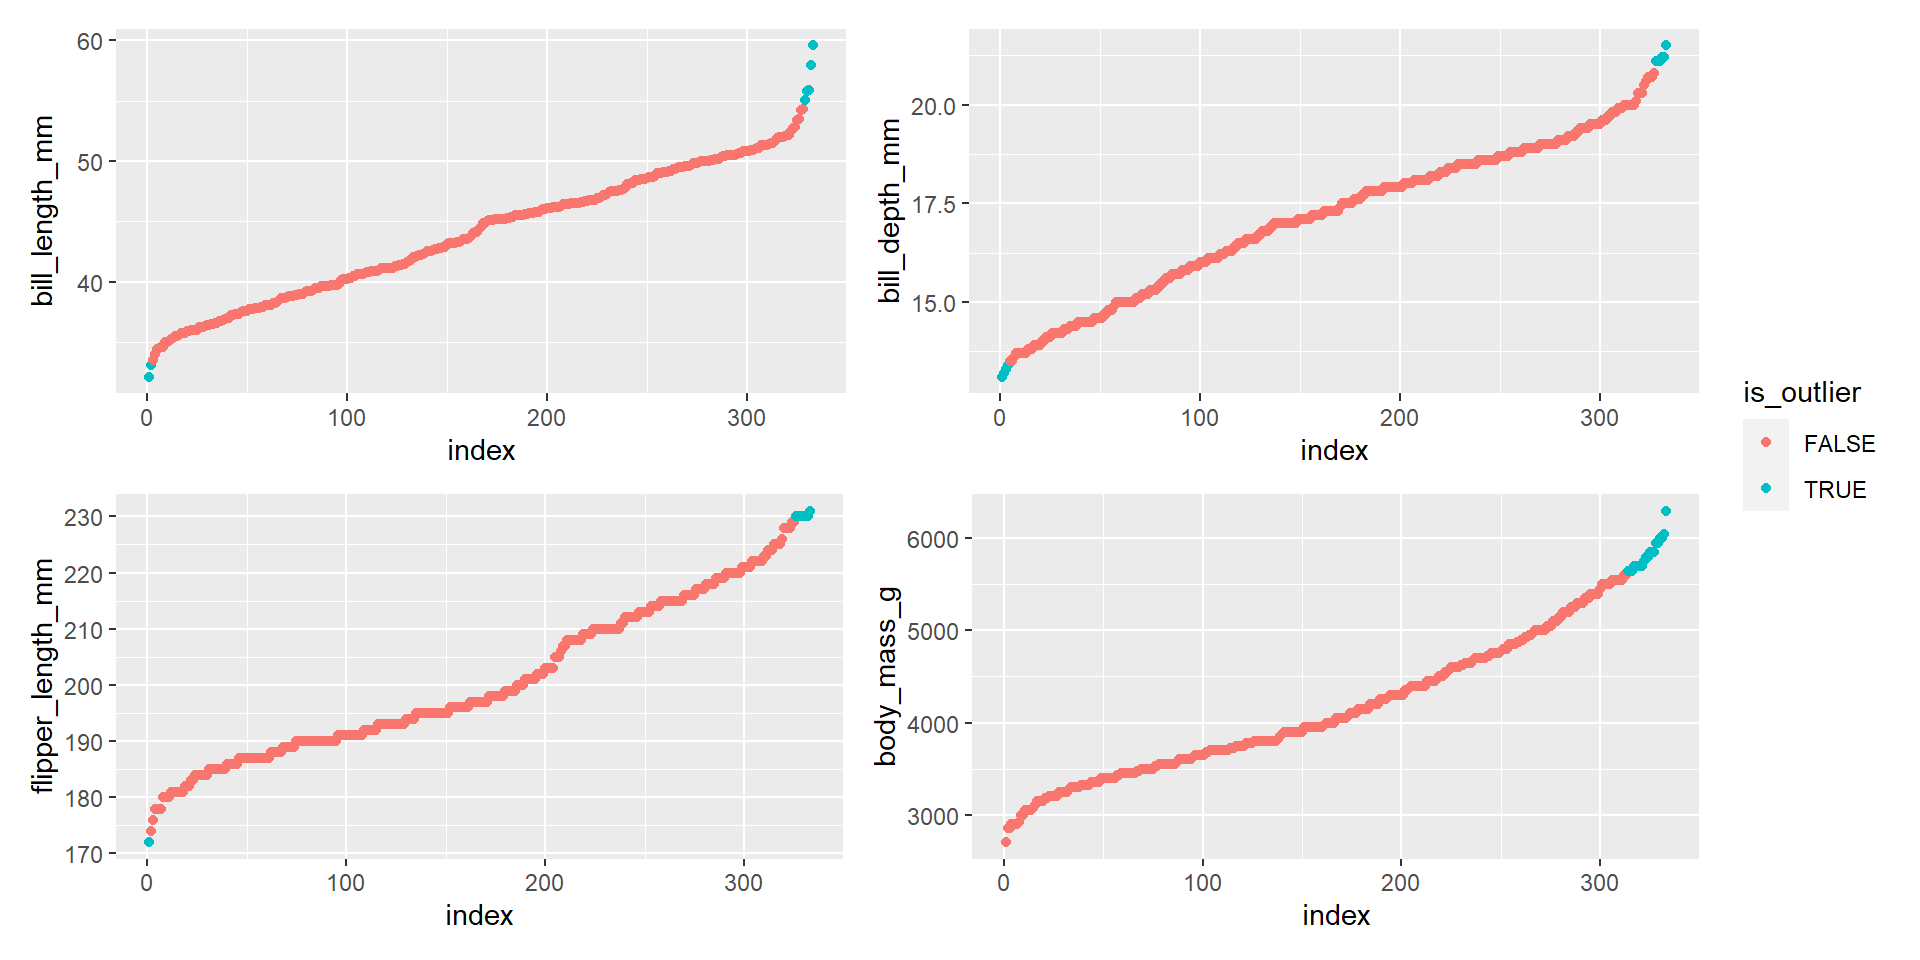
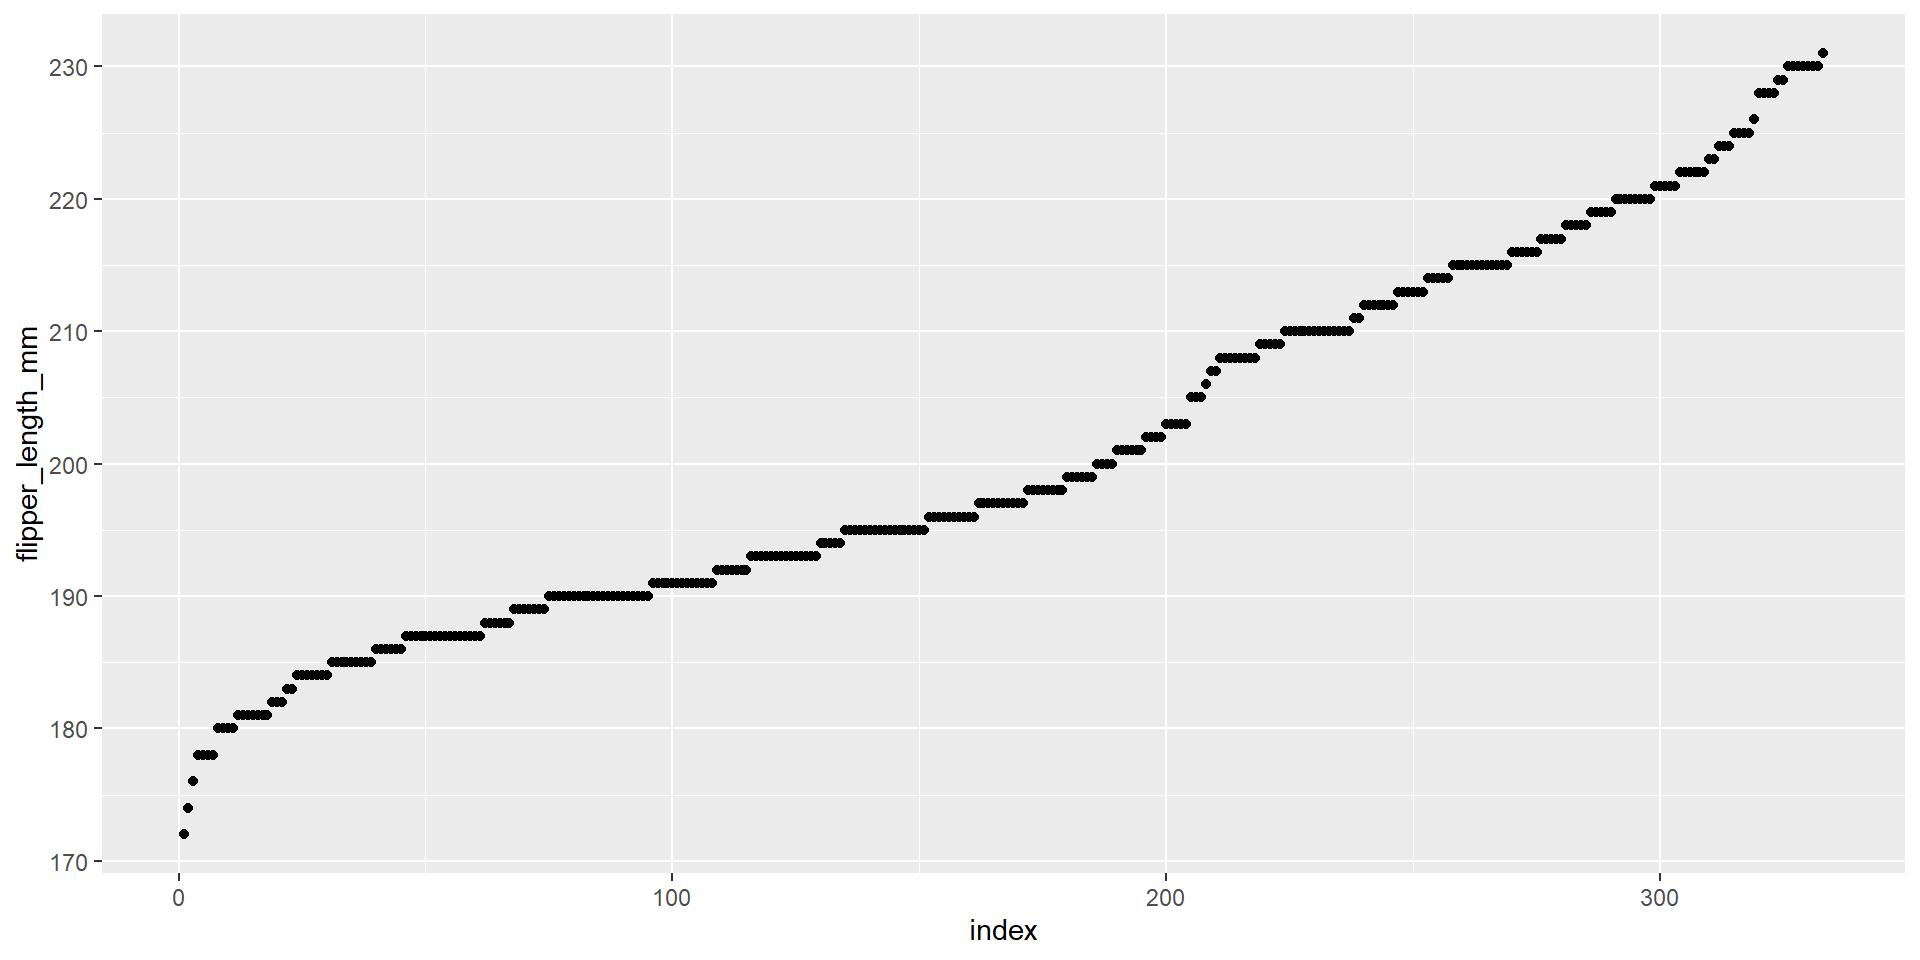
Basic Index Plot
There is no a default function in ggplot. How can we make it?
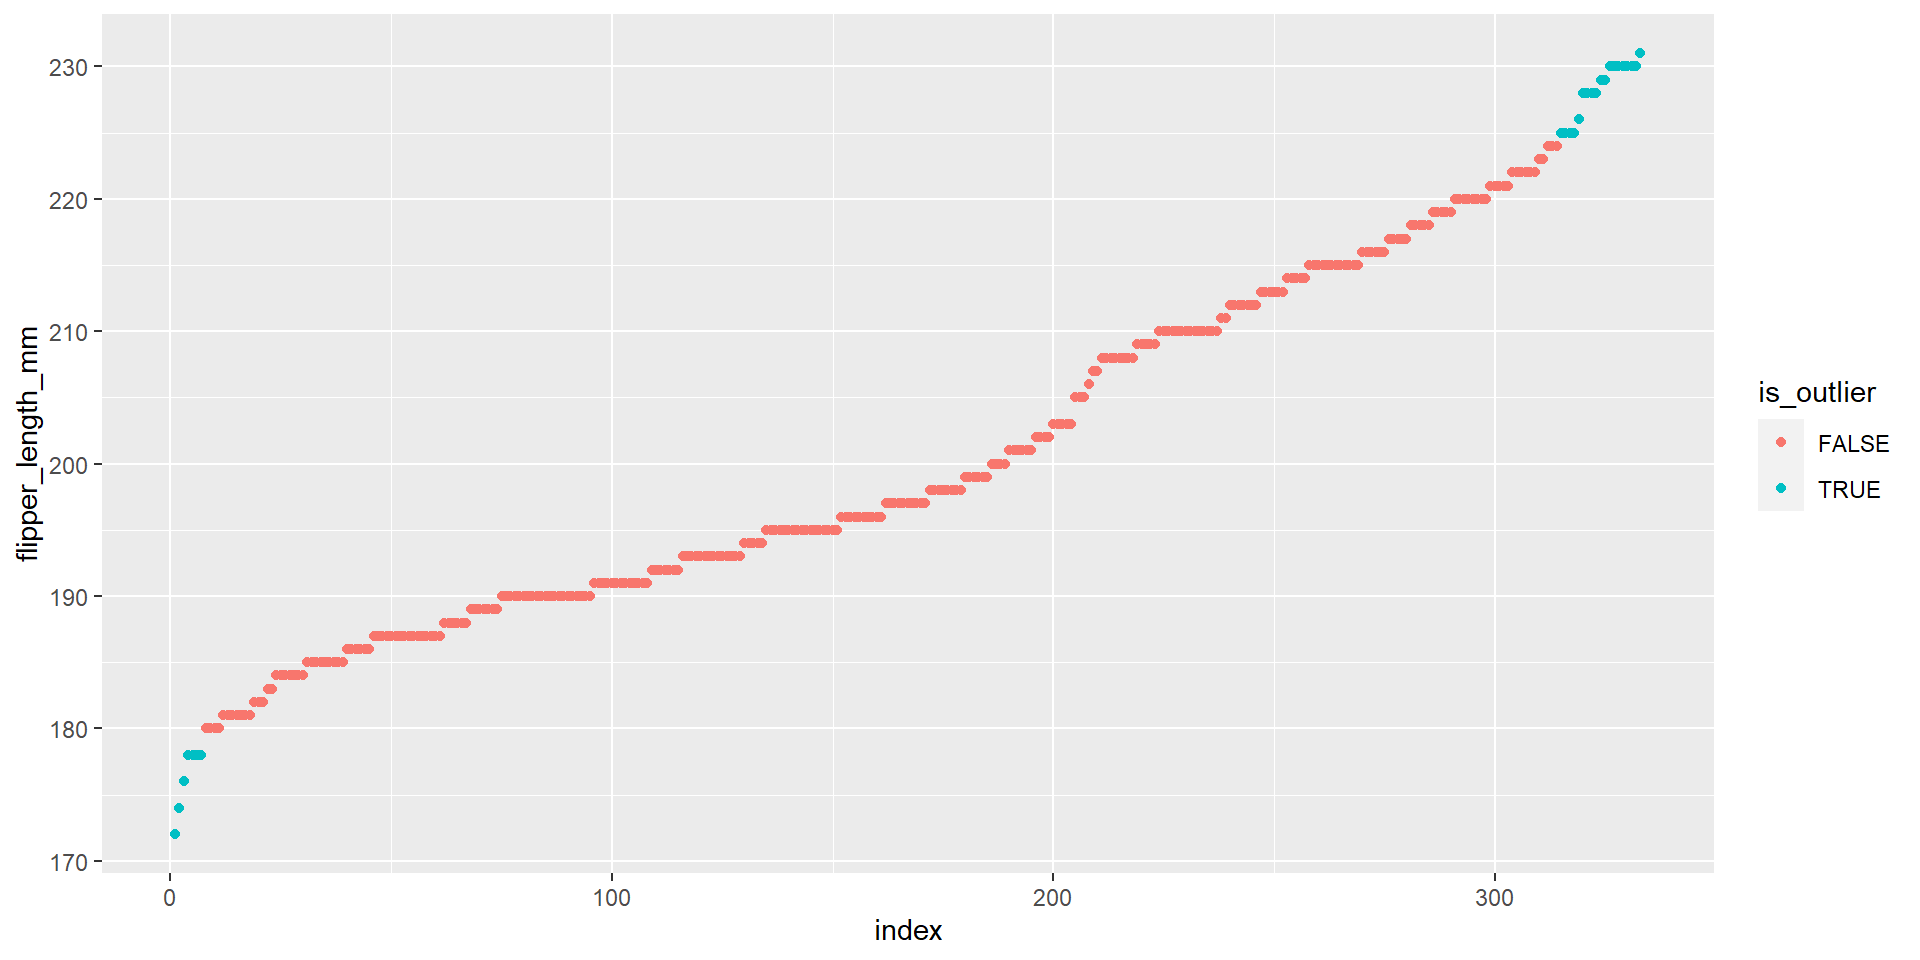
Index Plot with Outlier Detection
Use Tuckey’s fences with \(k = 0.5\) as outlier criteria. Hence \(x\) is an outlier if it is not in the interval \([Q_1 - 0.5\cdot IQR, Q_3 + 0.5\cdot IQR]\).
Bonus
Using \(k = 0.7\) to highlight extreme values. You need to install patchwork.