install.packages("package_name")Introduction to Tidyverse
Fundamentals of Data Science for NHS using R
Today’s Plan
- What is R?
- What is RStudio?
- What is Tidyverse?
- Practical Session
Let’s introduce the main characters of our story!
What is R?
R is a language and environment for statistical computing and graphics.
R provides a wide variety of statistical and graphical techniques, and is highly extensible.

Why Use R?
- R is free and open source
- Any type of statistics/data analysis can be done in R
- State-of-the-art graphics
- Import data from wide variety of sources
- R runs on all common platforms (Windows, macOS, Linux)
- On-line community is always helpful, supportive and inclusive
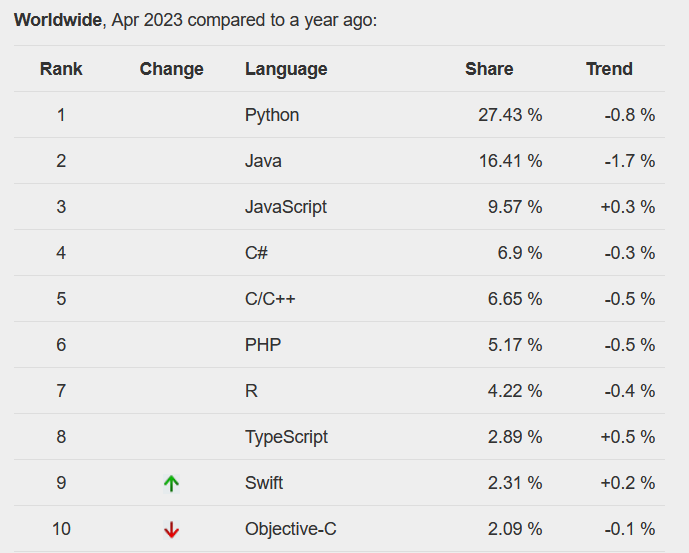
R Popularity
R is popular even if it’s just for statistics and data analysis!
R is ranked 16th in the TIOBE index and 7th in the PYPL index
NHS-R Community
Promoting the Use of R in the UK Health & Care System.
R Packages
R Packages are extensions of the base language (base-R). They contain functions and data that are not included in the basic installation.
They can be installed by users via a centralised software repository.
R’s most important software repository is called Comprehensive R Archive Network (CRAN).
Currently, the CRAN package repository features 19359 available packages.
What is RStudio?
RStudio is an integrated development environment (IDE) for R developed by Posit PBC.
RStudio PBC changed its name to Posit PBC last summer.


Posit Cloud
Data Science Workflow
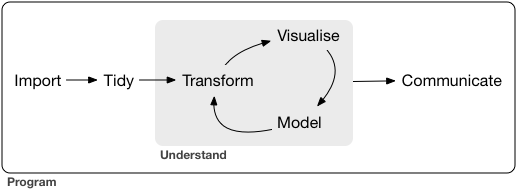
Tidy Data
Tidy data is data where:
- Every column is variable.
- Every row is an observation.
- Every cell is a single value.

What is the Tidyverse?
Tideverse is a collection of R packages designed for data science.

Tidyverse Critics
Not everyone agrees with the Tidyverse philosophy:
Some others instead think that is should be the first thing to learn when you meet R for the first time:
Tidyverse 9 Core Packages
ggplot2
Data visualisation
dplyr
Data manipulation

tidyr
Data tidying

readr
Data import (CSV and TSV files)
purrr
Functional programming
tibble
tibble data structure
stringr
Strings manipulation
forcats
Categorical variables
lubridate
Dates manipulations

Other Tidyverse Packages
hms
Time-of-day values manipulation
Import other formats
reprex
Ask for help in way that everybody can understand.
magrittr
Provides the %>% operator which is essential to write cleaner code.
From R 4.1.0 (May 2021) the pipe operator has been implemented in the base-R language and its syntax is |>.
See this link for differences.
Learning Resources
R for Data Science
This is where you should start!
R for Data Science work-in-progress 2nd edition by Hadley Wickham, Mine Çetinkaya-Rundel, Garrett Grolemund.
Other Links
STAT 545 by Jenny Bryan & The STAT 545 TAs
The Tidyverse Style Guide by Hadley Wickham
R Cookbook by James (JD) Long & Paul Teetor
Workshop Part 1: R and RStudio basics
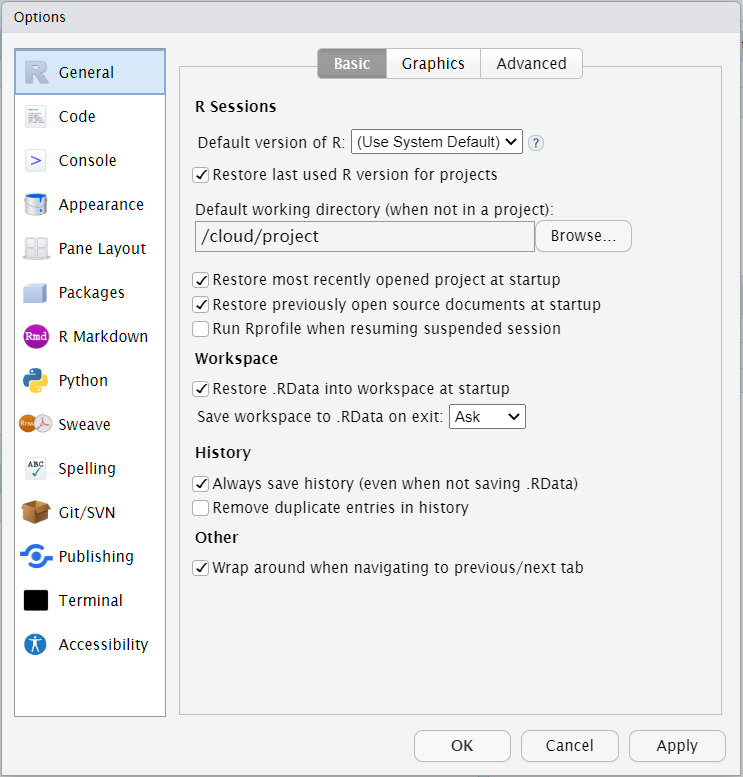
Custumize RStudio
The available options for the RStudio IDE are accessible from the Tools > Options menu.
A full reference of the available options can be found here.
Keyboard Shortcuts
A reference of the available shortcuts can be accesed from the Help > Keyboard Shortcuts Help menu.
Alternatively use keyboard shortcut Alt + Shift + K.
Install packages
We can install a package using the install.packages function.
Warning
The package name MUST be quoted!
Important
It’s good practice to run install.packages in your console and not including it in your script.
Load packages
We can load a package using the library function.
Warning
The package name MUST NOT be quoted!
Important
It’s good practice to write all your library calls at the beginning of your script.
Workshop Part 2: Introduction to dplyr
Palmer Penguins
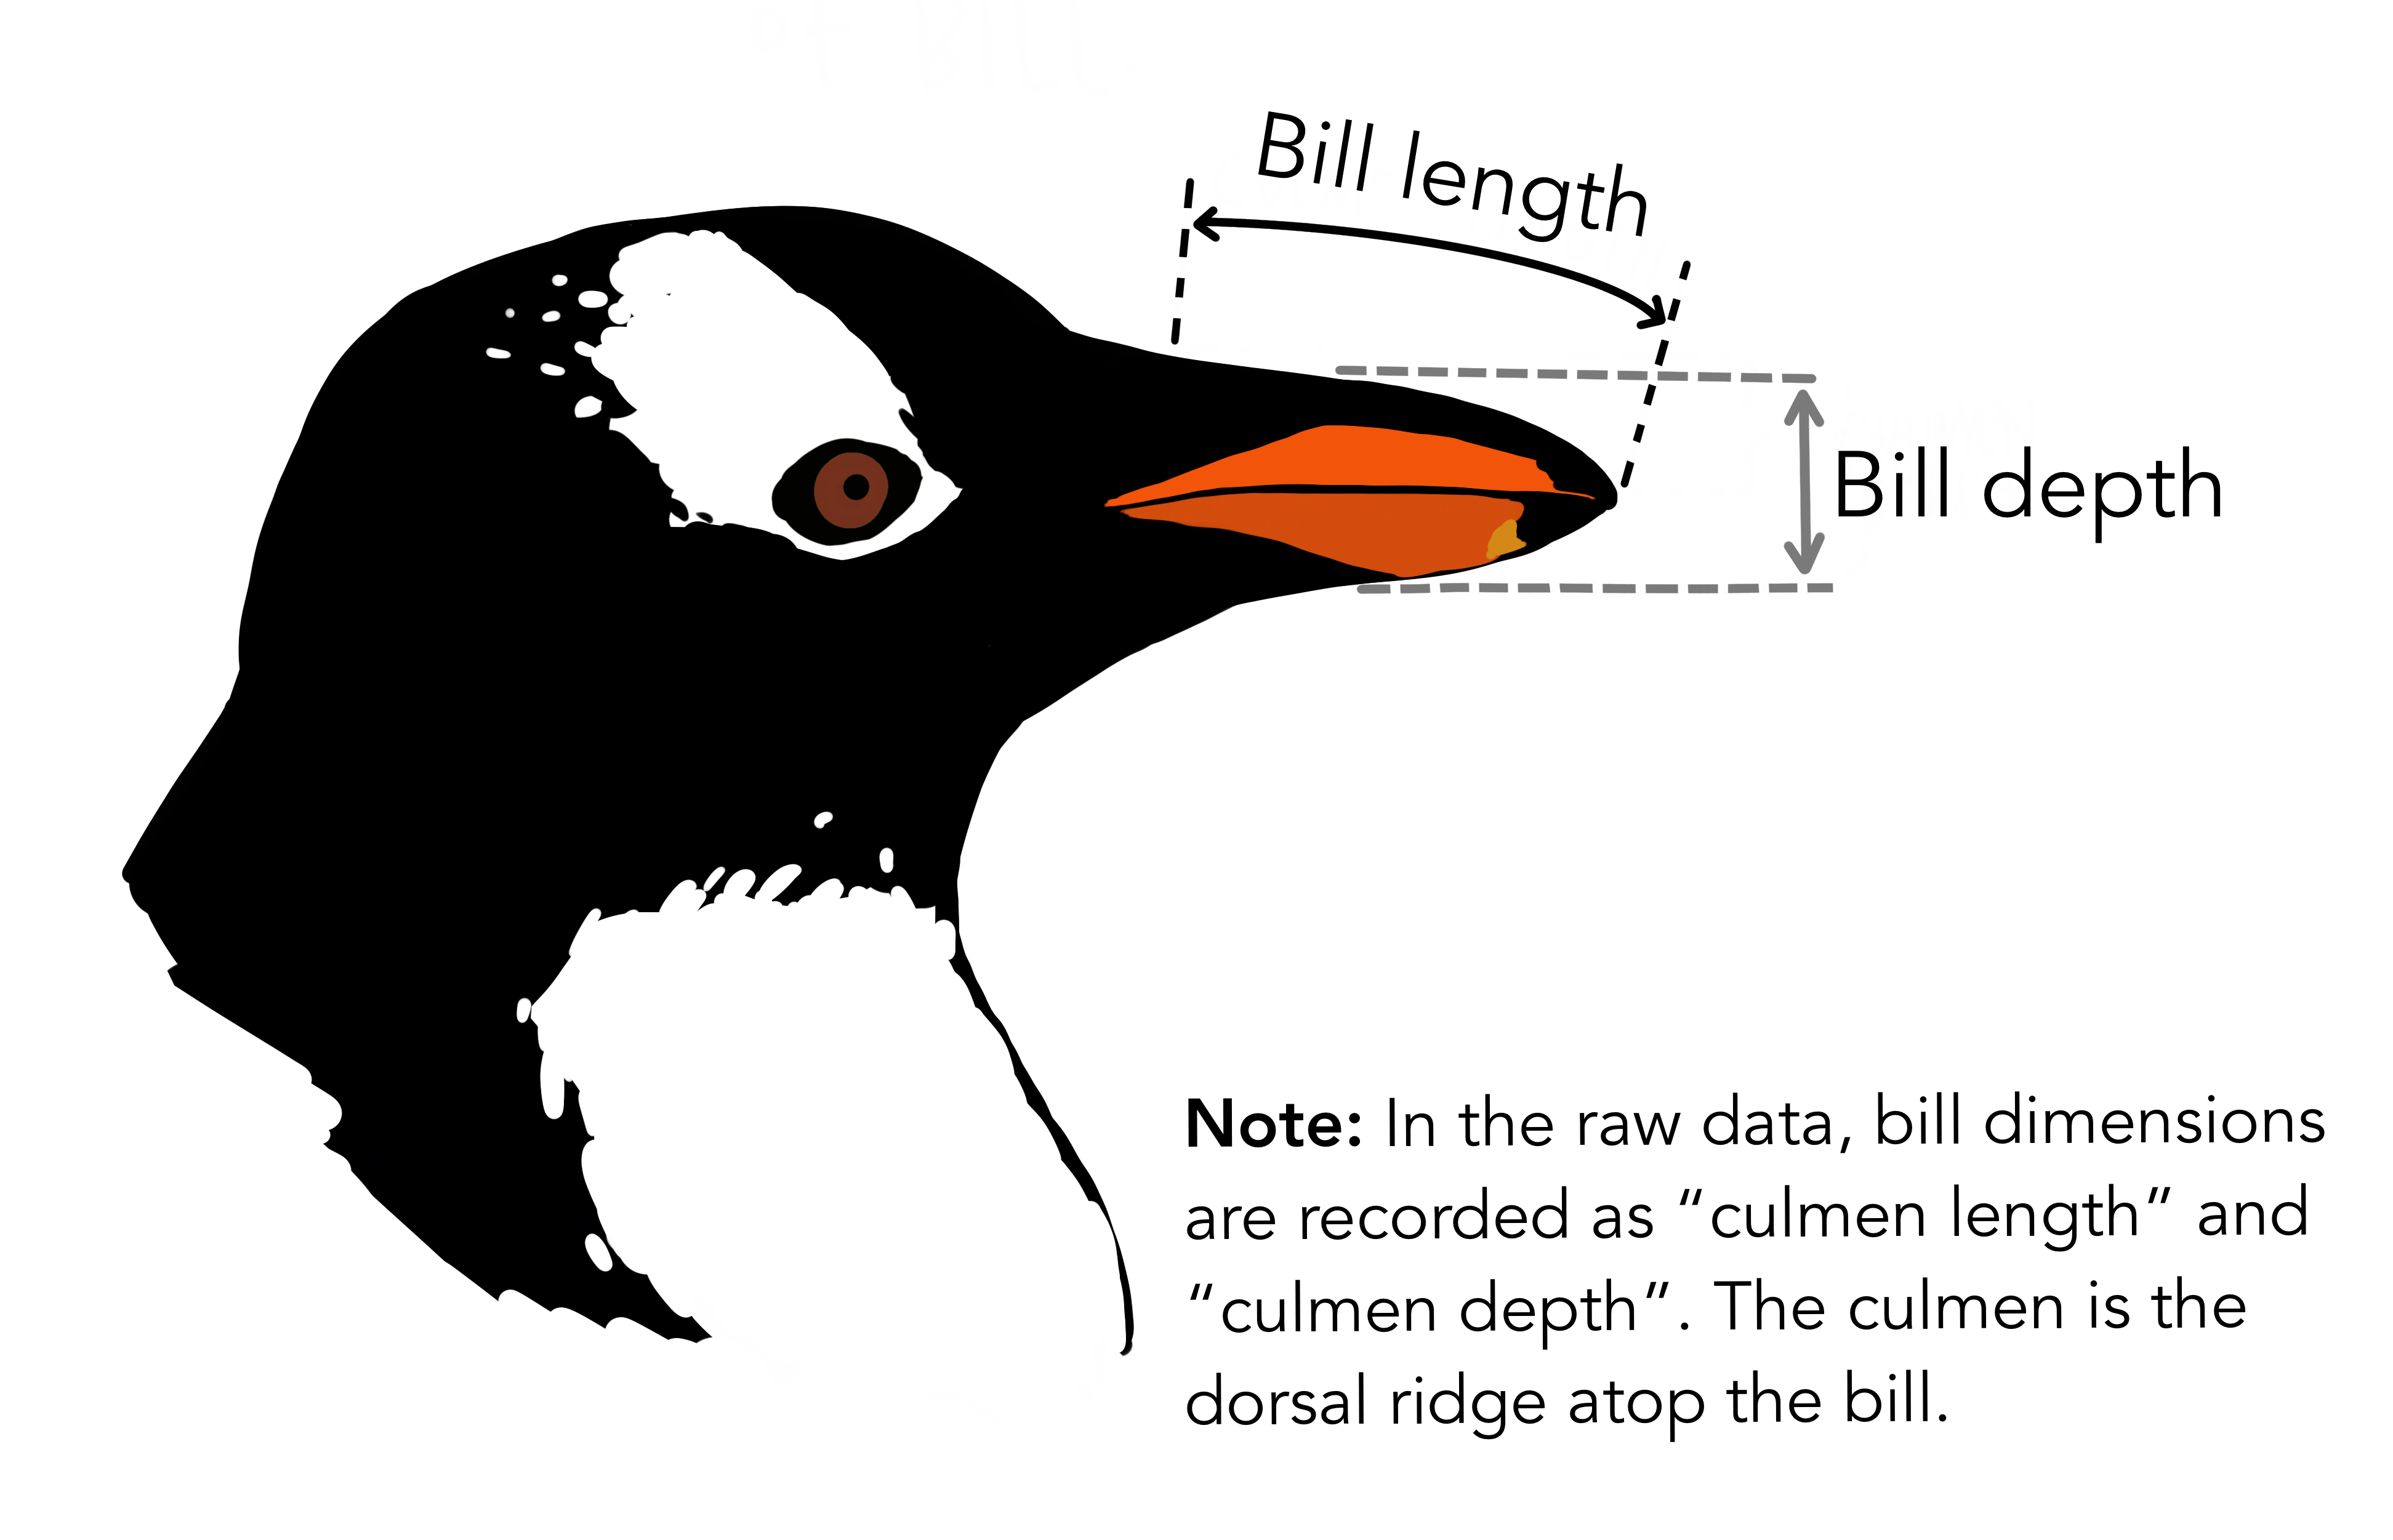
The goal of palmerpenguins is to provide a great dataset for data exploration and visualization.

Palmer Penguins Variables

What is dplyr?
dplyris a package that contains functions for data manipulation.It is automatically loaded when we call
library(tidyverse)as it is one of the core packages.First release 7th January 2014.
Original author Hadley Wickham.
dplyr is a grammar of data manipulation.
dplyr cheat sheet
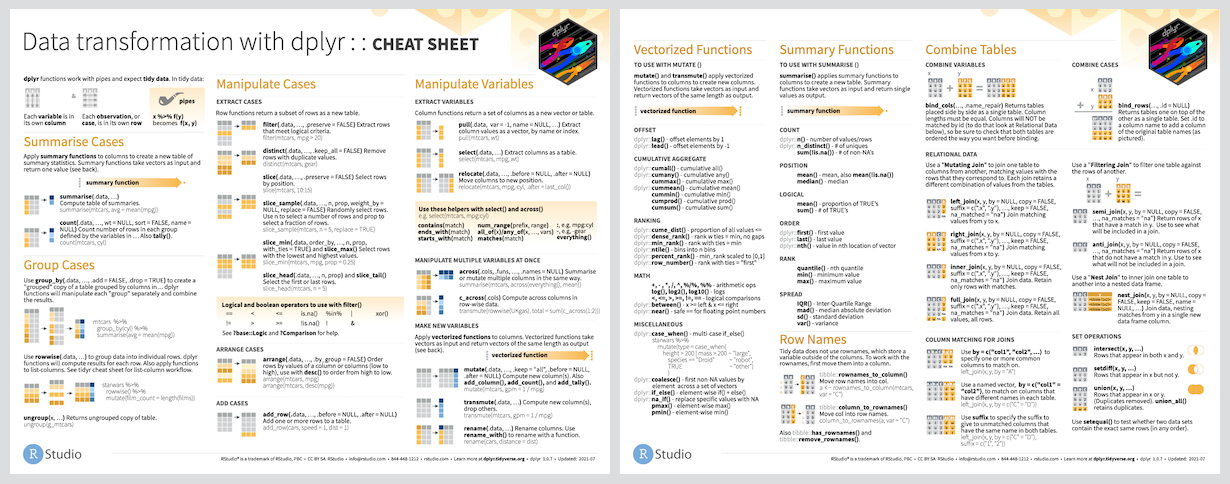
Single table verbs (for today…)
- Column verbs
select()subset by column
- Row verbs
slice()(and its friends) subset rows by positionarrange()order rows by column valuesdistinct()select unique rows
- Group verbs
count()count observation by group
Inspect the Data
We can output in the console the first lines of a dataset by using its name
We can see the whole dataset using view()
Another useful function is glimpse()
select specific variables
We can select specific variables. List their names as arguments of the select function.
select drop variables
We can select all variables but specific ones. List their names with a minus sign before the name of each variable you want to exclude.
select by matching strings
We can use helpers to match strings in the variable name.
starts_with()
ends_with()
contains()
For example
Multiple conditions can be combined using the logical operators and (&), or (|). We can also use the negation (!) operator.
select by variable type
We can use where() to specify variable type(s) to be selected. Possible arguments are
is.integer for integer
is.double for decimal
is.numerical for numerical (both integer and decimal)
is.factor for categorical
is.character for strings
For example
slice subset data by row number
slice(x) select the xth row.
We can also select more than one row by listing the corresponding row numbers.
To list consevutive rows use the : operator.
slice_head and slice_tail
slice_head(n = x)select the first x rows
slice_tail(n = x)select the last x rows
Alternatively we can use the prop argument to select a specified proportion of the data.
Other slice verbs
slice_sample()randomly selects rowsslice_min()andslice_max()select rows with highest or lowest values of a variable
arrange rows by column values
We can order rows by values of selected columns. List their names as arguments of the arrange function.
Use desc() to sort a variable in descending order.
distinct rows by column values
We can select unique/distinct rows.
Observe that
is equivalent to
count observations by group
We can count unique values of one or more variables.
A verb from tidyr
- Missing values
drop_na()drop rows containing missing values
Thank you!
In the next episode
- Column verbs
mutate()andtransmute()create, modify, and delete columns
- Row verbs
filter()subset rows by column values
- Group verbs
group_by()group rowssummarise()collapse row groups into a single row
Honorable mentions
- Column verbs
relocate()change column orderrename()change column name


